A rabbit hole about speed boats

The United States military killed more people on your behalf today, targeting a boat somewhere in the Caribbean Sea.

President Donald Trump and Defense Secretary Pete Hegseth shared footage of the destruction on social media, thereby fulfilling one of the apparent objectives of the strike. Hegseth used various Clancyesque vocabulary (though not “opsec”) while Trump celebrated the positive benefits for you, a U.S. resident.

The boat, he claimed, was “loaded with enough drugs to kill 25 TO 50 THOUSAND PEOPLE” but was stopped off the coast of Venezuela before it was able to “[enter] American Territory.”

As journalist Matt Novak pointed out, though, Venezuela isn’t terribly close to the U.S. So — even granting the administration’s claim that the boat was smuggling drugs, which one might be justified in not immediately granting — how imminent was the threat to the U.S.?

To answer this question, we need to know two things. First, how far was the boat from the U.S.? Second, how fast was it going? The second question is actually the trickier one, so let’s tackle it first.

The only information we have at our disposal is contained in the shared video. It shows a small vessel with what appears to be two outboard motors on the back. (See the pink box below.)

The appearance is consistent with what are called “go-fast” boats, boats stripped down to do little more than carry a lot of drugs a long way very quickly. In 2016, the FBI published a report on these sorts of vessels, explaining how the government tracked and captured their occupants. The story does not involve the extrajudicial invocation of capital punishment.

What the report doesn’t include is an estimate of speed. So, for that, we turn to analysis from Jake Tunaley of the London Research and Development Corporation.

“The hulls are usually made of fibreglass with a sharp, vertically rounded bow and a transom stern,” Tunaley writes of such boats. “They are typically 30 to 50 feet long with a narrow beam and powerful engines delivering up to 1000 hp. This gives speeds of greater than 80 kts in calm waters, 50 kts in choppy waters and 25 kts in 1.5 to 2 m Caribbean seas.”

The “kts” there refers to knots, nautical miles per hour. That’s what we’ll use for our calculations.

Next, we need to figure out the distance the boat had to travel. That means figuring out (roughly) how far it is from the “Coast of Venezuela” to “American Territory.”

The territorial boundary of the U.S. is generally 12 miles from our coastline. If a go-fast boat left from the point closest to the boundary in Florida, weaving between Cuba and the Dominican Republic, as shown below, that’s about 1,000 nautical miles.

Assuming calm seas, a constant 80-knot speed and no aerial or surface interdictions, a smuggler could cover that distance in about 12-and-a-half hours. Perhaps not as long as one might think.

But Florida is not the closest American Territory to Venezuela. Puerto Rico is. And it’s less than 400 nautical miles away.

That means that the boat could have covered the distance in about four-and-a-half hours. (You can see the math here.) The vessel could also have chosen a shorter route by heading to the U.S. facility at Guantanamo Bay, but that was probably not a desired destination.

These are very rough estimates, mind you, but the idea that a boat from Venezuela was headed to U.S. territory in short order is not that far-fetched. So we can instead spend our time wondering why, if the vessel was spotted near the Venezuelan coast, there wasn’t a way to impede its progress (and determine its intent and cargo) other than shooting ordnance at it to generate a social-media post.

The Americans who see ‘toxic masculinity’ as a problem — and those who don’t

Every year, the site 19th News conducts a national poll with SurveyMonkey that focuses heavily on issues of gender in American politics and society. This may not sound interesting, much less remarkable, but it is. Polling isn’t cheap, meaning that media outlets tend to focus on issues in the news and electoral questions. Detailed analyses of more fundamental aspects of the U.S. is invaluable.

I’m going to focus on a set of questions evaluating how Americans view gender roles, as the headline promises, but I do want to share one striking finding: Most Americans know someone who is non-binary. That includes half of Republicans and Republican-leaning independents! (Those independents are what the “+lean” parenthetical below means.) Black Americans are the racial group least likely to know someone who identifies that way.

As you might expect, given broader trends in LGBTQ identity, younger Americans are more likely than older Americans to know someone non-binary. But even 4 in 10 Americans aged 80 and over say they do.

So when Donald Trump was running all those ads in 2024 attacking Kamala Harris as being for “they/them,” half of his voters could visualize someone they knew who he was talking about.

As I mentioned, the poll also presented respondents with a series of statements, asking whether they agreed or disagreed with the sentiment. On net — that is, subtracting those who disagreed from those who agreed — Americans didn’t agree with the idea that society would benefit from young people having families before pursuing career accomplishments or other goals.

But they did agree on net that families are better off when a parent stays home with kids and (to a much narrower degree) that there would be a benefit to returning to traditional gender roles. That’s because men were 23 points more likely to agree than to disagree, while women were 17 points more likely to disagree than to agree.

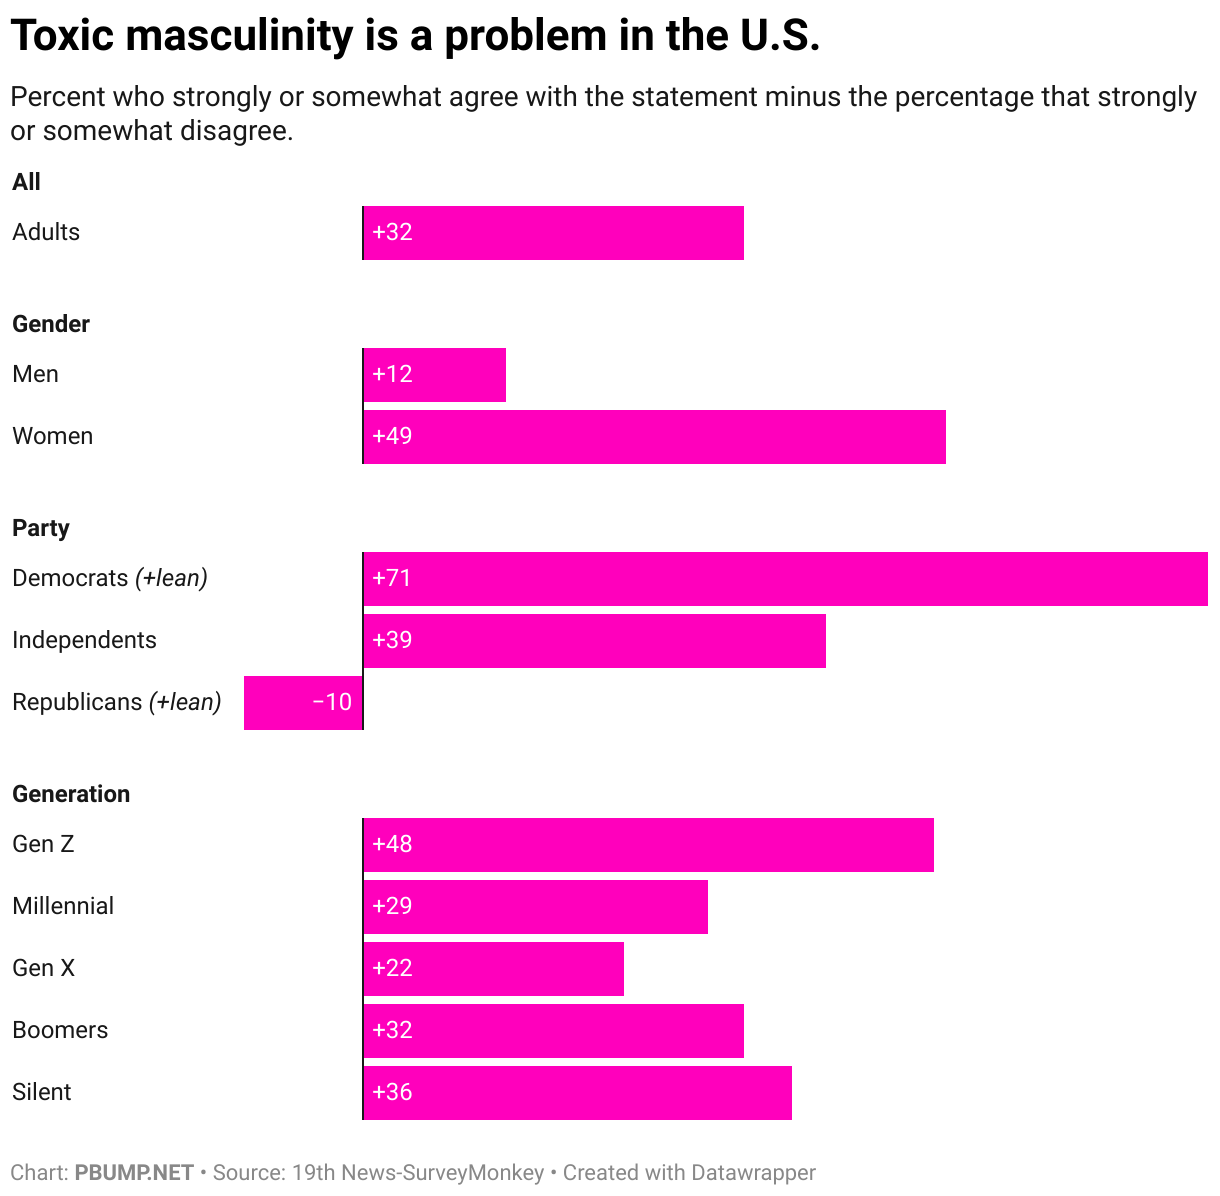
I want to drill down on the idea that toxic masculinity is a problem for society, something that was viewed with net agreement to the same extent that having a parent stay home was. (By the way, most of those who said one parent should stay home said it should be whichever parent wants to stay home.)

Here, again, there was a wide gender gap, with women being far more likely to agree it’s a problem than were men. There was also a partisan gap: Democrats and independents overwhelmingly see toxic masculinity as a problem while Republicans are more likely to disagree than agree that it is.

Generationally, it’s the youngest and oldest Americans who agree on net that toxic masculinity as a problem. More on that in a moment.

Broken out by race and gender, White men are the least likely to agree on net that toxic masculinity is a problem, save for men from other racial groups than those identified by the pollsters. In each racial group, women were more likely to agree on net than were the men.

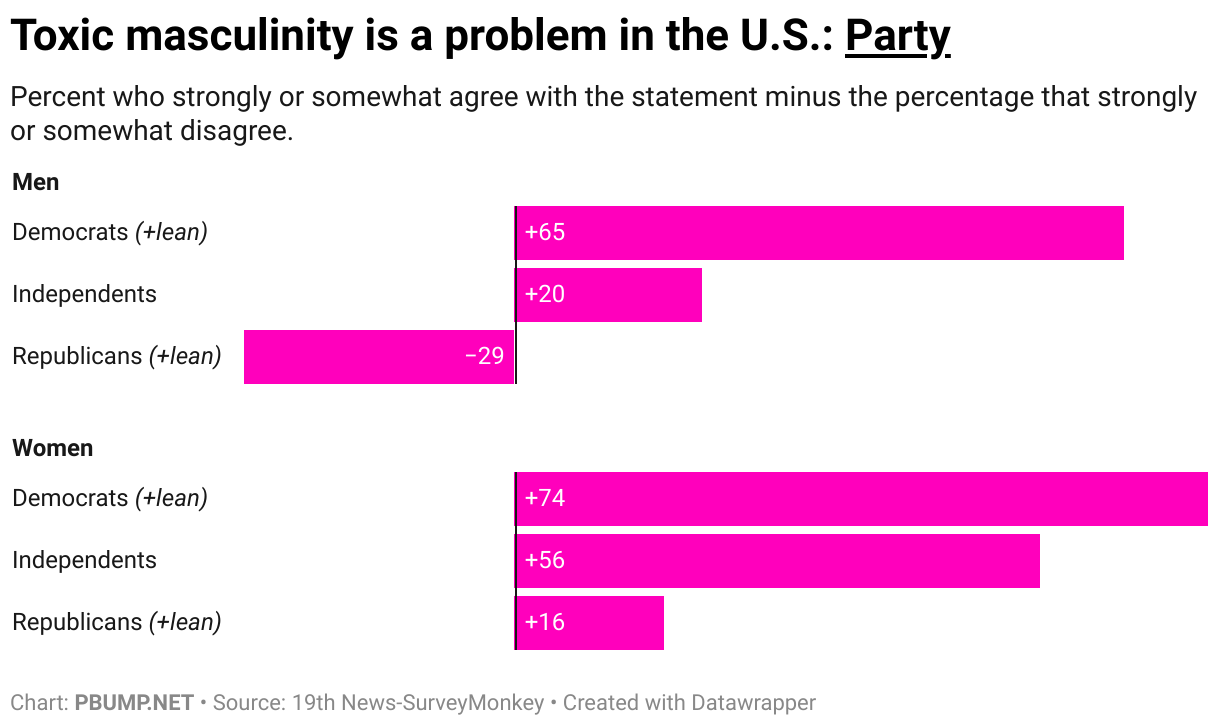
The same holds by party. Notice, though, that Republican women are more likely to agree that toxic masculinity is a problem than to disagree with that idea.

Overlapping these responses, White, married evangelical men are among those most likely to say that they disagree that toxic masculinity is a problem. Make of that what you will.

When we look at the results by generation, we see a decline in agreement among millennial and Gen X respondents among both men and women, though women remain much more likely to agree with the idea than men regardless of age group.

Diving even deeper into the crosstabs — meaning, I must note, that we’re increasing margins of error — we see some interesting splits by age and race. Black men, for example, are generally likely to agree that toxic masculinity is a problem at consistent levels. White and Hispanic men, though, are not.

This chart also supports the “Gen X is the most reactionary generation” narrative — particularly among White men.

You will notice that I have not spent time here actually adjudicating claims about toxic masculinity or even its definition. Neither did the poll. For the most part, it’s beside the point.

I will note, though, that the group most likely to say they disagreed somewhat or strongly with the assertion that toxic masculinity is a problem in the U.S. was Republican men. The group second most likely to say so? 2024 Trump voters.

Photo: Artifacts from the Women’s Equality National Monument. (National Archives)

Sorry about your luck, 24 million Trump voters

It has been the case since Donald Trump’s first tenure as president that he wants to slice the size of the federal workforce. During his period in the political wilderness (also known as the Biden administration), his allies, led by his first-term Office of Management and Budget director Russ Vought, put together a hefty document that included recommendations for sweeping layoffs. When Trump returned to office in January, bringing Vought with him, he and his team (then including Elon Musk) began indiscriminately laying off federal employees.

All of which is to say that the administration’s recent declarations that the shutdown allows them to slash the federal workforce are not Trump and Vought suddenly seizing upon a new idea. Instead, the shutdown offers a pretext for doing what they wanted to do anyway, to shift some of the blame for something that hasn’t proven too popular.

The same holds for other elements of the administration response to the shutdown. It’s a disruption in government that is also letting a team that has demonstrated its indifference to rules about spending and management lean into the punitive responses it has always sought.

Consider an announcement from Vought that he made on Musk’s social media platform on Wednesday.

Vought identified 16 states as targets of billions of dollars of cuts. The states below, to be precise.

Perhaps that map reminds you of something. Well, allow me to put a fine point on it.

These states also include a number of the country’s most populous. In fact, nearly 4 in 10 Americans live in states that Vought has announced will be the targets of cuts.

These are also states that contribute disproportionately to the nation’s gross domestic product.

The targeted states received $191 billion more in government services than they paid in taxes in 2023. Non-targeted states received much more in government spending, receiving $1.1 trillion more than they paid.

These sorts of things are generally abstractions to the president. So let’s put it in terms he might appreciate a bit more. While most of his voters live in non-targeted states (as do most of those who voted for Kamala Harris last year), nearly a third of 2024 Trump voters — some 24 million — live in states targeted for cuts.

The cuts Vought has presented are modest (in the scale of the federal government) and he frames them in a way that Trump voters are unlikely to oppose. But if Vought means spending from the bipartisan infrastructure bill, he’s talking about impeding money that often went to building and improvement projects, not whatever Republicans think of when they think of “Green New Deal” spending.

In other words, it’s very likely that Trump’s base will feel the negative effects of the administration’s partisan attacks. And not for the first time.

Photo: Russ Vought at the White House, March 2019. (White House/Flickr)

Digging deep on the presidential electorate

After every federal election, Pew Research Center conducts an incredibly useful bit of polling: asking Americans what they did on Election Day and validating that those who reported voting were actually registered voters. It takes a few months for the analysis to be completed, but the result is one of the most useful and detailed assessments of the electorate — and the non-voter pool — that is publicly available. Think exit polls, but more reliable.

I’ve used this analysis (the 2024 iteration of which was published in June) in the past to evaluate how Donald Trump’s base has evolved since the 2016 election. But after seeing a social-media post this week (which I’ll share in a moment), I realized that there’s a lot more information that can be presented to help explore how the 2024 election unfolded.

I came up with a little game. Below is a blank scatterplot, a chart that contrasts the margin of support in the presidential race (from more Democratic at left to more Republican at right) with the percentage of voters a particular demographic group constituted last year.

I know that’ complicated, so let me just explain what to do. Figure out what percentage of the electorate were White men last year and what margin they preferred the Democratic (Kamala Harris) or Republican (Trump) candidate in the election. If you think that they were 100 percent of voters and split evenly between Harris and Trump, you’d be wrong. But you’d click/tap right at the top center of the chart — at the place where 100% of the electorate meets zero on the left-right spectrum. If you think they were 50 percent of voters and backed Trump by 50 points, you’d tap/click at the intersection of the second horizontal line down and the third vertical line from the left.

That’s confusing, too. So just try it.

Where did White men fall among all voters in 2024?

Once you do, it tells you how close you were. Was the actual value where you thought it would be?

Now try to guess where the values for Black voters (all of them, not just men) landed last year.

Where did Black voters fall among all voters in 2024?

Contrast that with the values for White evangelical Protestant voters.

Where did Evangelical voters fall among all voters in 2024?

Why that comparison? Because it was a post from my former colleague Perry Bacon that inspired this experiment.

The number of white evangelicals backing Harris in 2024 is around the same as Black voters backing Trump. (15 percent of the group).

— Perry Bacon (@perrybaconjr.bsky.social) 2025-09-28T13:55:00.671Z

You’ll notice that his point is about shares of voters for Harris and Trump, not voters overall. We can test that, too. (Note the change in the question below.)

Where did Black voters fall among Democratic voters in 2024?

We can run the same experiment for years past, given that Pew’s been doing this since 2016.

Where did Black voters fall among all voters in 2016?

The Pew data encapsulates an enormous range of demographic groups, particularly in more recent years. (There are some caveats I mostly elide here; feel free to go read the methodology in detail.)

Where did Hispanic voters fall among all voters in 2024?

At the bottom of this article is a version of the scatterplot that lets you compare demographics and years directly. One thing you might want to play around with is how voting shifted by age. For example, try your hand at how young voters voted in 2024…

Where did voters under 30 fall among all voters in 2024?

…versus 2016.

Where did voters under 30 fall among all voters in 2020?

And then compare that with older voters.

Where did 65 and older fall among all voters in 2024?

One demographic group I found interesting to consider, given the amount of attention that has been paid to it over the past few years, is Jewish Americans. Where do you estimate their support lands on our chart?

Where did Jewish voters fall among all voters in 2024?

Anyway, here’s the whole thing. Lots of categories and cross-tabulations to explore. There are some gaps in the data for 2020 and (more often) 2016, so if a dot doesn’t show up on the chart for some combination, that’s likely why.

SELECTION

COMPARISON

Find something particularly surprising? Let me know on social media or by email!

Photo: Balloon drop at the 1972 Republican convention. (National Archives)

How Trumpworld inflates the perceived danger of the left

It is stipulated at the outset that there have been gruesome acts of political violence in recent months that appear to have been motivated by hostility to right-wing politics or the administration. This is not really contestable and rarely seriously contested. There is, in fact, violence on the political left.

It is also the case, though, that right-wing political violence has been much more common in recent years. This is not a useful bit of information to the Trump administration, which actively seeks to ignore or bury it. The administration, like Trump himself, is committed to presenting political violence as centrally if not entirely a function of the left — obviously in part because doing so provides a rationalization for the administration to crack down on the president’s political opponents. Trump’s been champing at the bit to deploy the military against protesters, a desire so obvious that questions about his doing so were part of Pete Hegseth’s confirmation hearings to serve as Defense Secretary.

Over the weekend, Trump announced on social media that he would be directing the (since-confirmed) Hegseth to “provide all necessary Troops to protect War ravaged Portland, and any of our ICE Facilities under siege from attack by Antifa, and other domestic terrorists.” He further “authoriz[ed] Full Force, if necessary” — apparently giving the military a green light to shoot at the purported “terrorists”.

Why Portland? Well, that’s an interesting story that reflects one of the central ways that Trump and his allies convince the right that there’s an imminent threat — a tactic so convincing that it apparently convinced Trump, too.

Bad reporting

In mid-June 2020, I noticed something weird about Fox News’s coverage of the racial-justice protests that had emerged in response to the killing of George Floyd: they were often accompanied by footage of violence or vandalism that had actually occurred more than a week prior. Tucker Carlson (then still a Fox host), Sean Hannity and Laura Ingraham were incorporating footage into their shows that had been recorded in late May. The reason for doing so wasn’t subtle; they (and Trump, who was president) hoped to suggest that a firm hand was needed to keep the lunatic left under control.

It didn’t work. But what I couldn’t have anticipated then was that Fox would still be using that footage five years later.

For a moment, Trump seemed to waver on his threat to send troops to Portland. In an interview with NBC’s Yamiche Alcindor, he described a conversation he’d had with Oregon’s governor.

“I said, ‘Well wait a minute, am I watching things on television that are different from what’s happening? My people tell me different,’ ” Trump said of the conversation. “They are literally attacking and there are fires all over the place…it looks like terrible.”

Well, yes, Man Who Has Access to the Breadth of Federal Intelligence Gathering. What you saw on TV was in fact not what was happening at the moment in Portland.

So what had Trump seen? Given his tendency to stay tuned to Fox News we can make some educated guesses.

Trump made his pledge to send troops to Portland on Saturday morning. On Friday, Fox News had several segments in which purported violence in the city was shown.

One featured Tricia McLaughlin, a Homeland Security official who often appears on cable shows. As she was discussing an executive order Trump signed, the channel showed b-roll of events in Portland.

Sept. 26, 2025. (Internet Archive)

You will notice, though, that the footage was not timestamped for any date in September. Instead, they showed an encounter apparently involving tear gas that occurred back in June … and footage from protests in July 2020.

In the next hour, they ran the same playbook. Former House Speaker Newt Gingrich was on, talking about how dangerous the left was next to footage of Portland violence from July 2020.

Sept. 26, 2025. (Internet Archive)

If this is what Trump was seeing, one can see how he might have been confused about the timeline (particularly if he wasn’t wearing his glasses). You can also see how the average Fox News viewer might be under the impression that Portland is a violent hellscape.

Particularly given the extent to which Fox News otherwise frames its coverage. The McLaughlin interview, for example, included a graphic purporting to show arrests of “antifa-aligned left-wing violent extremists” across the country — a series of events across the country that would seem to bolster Trump’s anti-antifa (is there a more concise way to say that?) executive order.

Fox News still, Sept. 26, 2025. (Internet Archive)

But the graphic is not only conflating arrests of protesters with “violent extremists,” it’s looping those purported extremists in with the category “antifa” — presenting people who oppose the administration’s actions with the sort of extremism that Trump is targeting. It’s an exaggeration almost as egregious and obvious as the use of vandalism footage from 2020.

Bad data

On Sunday, deputy White House press secretary Abigail Jackson took a different tack in suggesting that the left was uniquely dangerous. She shared a story from Axios with the useful headline, “Study: Left-wing terrorism outpaces far-right attacks for first time in 30 years.”

Jackson summarized the headline as “left-wing terrorism climbs to 30-year high,” a claim at odds with the graphic that accompanied the link in her social-media post. The number of attacks in 2022 was higher than the number this year, for example, though the 2025 numbers are only through July 4.

Perhaps you noticed something else striking about that chart! Here, take a closer look in case you didn’t.

Yellow is left-wing attacks. Gray is right-wing attacks. Knowing that, is your assessment of the problem the same as Jackson’s?

If we get rid of the stacked columns, the difference is even more obvious. The blue/left-wing line does finally emerge from the shadow of the right-wing mountain range … at least through July 4.

If we look at the three-year average of these events, we get a better picture of what’s been happening in the U.S. Yes, left-wing attacks (as measured by the Center for Strategic and International Studies) have been rising since the mid-2010s. But, in about the same period, right-wing terrorism began to skyrocket.

The researchers’ finding about the emerging gap between left- and right-wing attacks depends on the idea that there has been only one right-wing attack this year, the assassination of Minnesota Democrat Melissa Hortman. There has been a “striking” decline in right-wing terrorism, they write, allowing left-wing attacks to have become more common.

Explanations for the drop are “speculative,” they note, but they do offer a possibility: “many traditional grievances that violent right-wing extremists have espoused in the past—opposition to abortion, hostility to immigration, and suspicions of government agencies, among others—are now embraced by President Trump and his administration.” Put another way, the White House has gobbled up the right-wing fringe, meaning there’s less reason for fringe actors to use terrorism to effect their desired outcomes.

This is not the story the administration and its allies want to tell, though. So they center not on the fact that there have been four times as many right-wing as left-wing attacks in the past decade but on the determination that there have been five times as many left-wing attacks this year — since five is five times one.

And if you aren’t convinced that the left is more dangerous, just wait until you see what people were doing in Portland five years ago.

Photo: Trump watches himself on Fox News at the White House, June 27, 2025. (White House/Flickr)

Update: After this was published, it became clear that Trump hadn’t given up on his idea of invading Portland, so I tweaked the language I’d originally used.