A review of 2,871 Opening Days — and the seasons that followed

Relatively few Americans care anymore, but Thursday is baseball’s Opening Day. For fans like myself, baseball’s annual return plays a role not dissimilar to the role of the equinox in prehistoric days: a celebration of rebirth, of spring, of a glimmer of positivity after a long stretch of pessimism. It is one of the few days during the year, too, when it is still possible for the New York Yankees to go 0-and-162, as they deservedly should.

History suggests they won’t. In fact, history suggests that they’re likely to win their first game of the season (a day early, against the San Francisco Giants on Wednesday).

See, because my schedule is rather light these days, I decided to see whether the first day of the baseball season actually told us anything. Using the game-by-game data available at Retrosheet, I pulled each franchise’s Opening Day record for as far back as they have been playing ball. The result was necessarily mottled; at least in the era of electric lights, when one team wins on Opening Day, another team has to lose.

The longest stretch a team has gone in winning their first games of the year is ten seasons, a record held by both the Astros (2013 to 2022) and the Braves (1887 to 1896).

At the time, the Braves were the Boston Beaneaters. And that pattern of Opening Day victories didn’t last; over the history of the franchise, the Braves have lost more Opening Day games than they’ve won. That’s true of 13 other major league franchises as well. The worst Opening Day winning percentage, though, belongs to the Royals.

The best? The Amazin’ New York Mets.

Of course, there’s a difference between how a team fares on Opening Day and how it fares in its first home game of each season. Just as Opening Day necessarily means that one team wins and one loses, it also means that one team is at home and one is on the road. If we look at how the teams have done in their home-stadium openers, the results are a bit better.

When looking at each franchise’s first home games, the win record jumps to 11 straight seasons — an accomplishment achieved, I regret to inform you, by the 1998 to 2008 New York Yankees.

In fact — and I really regret to inform you of this — the Yankees have the best overall record in first home games of any franchise.

Again, franchises usually have had more wins in their first home games than their first games of the season because home-field advantage is a thing. But that’s not universally true. Some franchises, like the Dodgers and Reds, have better Opening Day records than first-game-of-the-season records.

I was curious whether Opening Day could actually tell us anything about how the rest of the season is likely to go. And what I found was … well, kind of.

On average, teams that win their first games of the year go on to win more than half of their games in a season. Teams that lose their first games of the year go on to win less than half of their games in a season, on average.

In the past decade, that’s been more pronounced: the gap between first-game winners and first-game losers was 4 points of winning percentage over the course of the season, compared to about 2.5 points over the history of the game.

This isn’t because winning the first game of the season puts teams on an unswerving path toward victory; the season is 162 games long, for God’s sake. Instead, it simply suggests that teams that win the first game are probably better than other teams, which shakes out over the course of the season. That’s reflected in the difference between road and home wins to start the season: Teams that win on the road on Opening Day have higher season-long win percentages on average than in any other scenario.

Above, I was looking at average win percentages — a look at how many games teams won, on average. If we look instead at winning seasons, we see a sharper division. When teams won the first game of the season over the past decade, they’ve gone on to have a winning season about 60 percent of the time. When they lose the first game, that frequency drops below 40 percent.

You are probably wondering (as I did) how the eventual champions did on Opening Day. You will perhaps not be surprised to learn that the teams which have appeared in the World Series since 1905 have won the first game of their season about two-thirds of the time. The average overall is about 50 percent (naturally).

There are exceptions. When the Boston Red Sox finally broke their curse in 2004, the not only lost their first game of the season (on the road in Baltimore) but also their first home game of the season (against Toronto five days later). But all of that was in the distant past when they came back from a three-game-to-zero deficit in the American League Championship Series to win and then win the World Series.

The team they beat in the ALCS, you may recall, was the New York Yankees. A team that, that year, also lost on the road Opening Day. And the team the Sox beat in the Series was the Cardinals — who lost on Opening Day at home.

Photo: President Harry S. Truman throws out the first pitch at Griffith Stadium on Opening Day, 1950. (National Archives)

Trump likes spending federal dollars

If you began paying attention to President Donald Trump’s political career in, say, January 2025, you might be surprised to learn that the federal debt is at a record high — some $39 trillion.

That’s about double what it was ten years ago, when then-candidate Donald Trump repeatedly objected to the debt increase under Barack Obama. But it also comes a bit over a year into a Trump presidency that, at least at the outset, was heavily centered on reducing spending.

Of course, if you began paying attention to Trump’s political career during his first term, this is much less surprising. Despite his criticisms of Obama (on a lot of things), the federal debt increased substantially the first time Trump was president. That was the case even before the coronavirus pandemic triggered an increase in spending and, by extension, the debt.

As a thought exercise, I created this interactive showing the daily increase in the federal debt during the first years of every president’s terms since 1997. Can you pick out Trump’s second term?

Which Line Is Trump’s Second Term?

Despite the debt being held flat for much of the first year of Trump's second term (because of the debt ceiling), the debt increased more rapidly during that year than in all but a few other first-years-of-terms in the past 30 years.

Brookings has been tracking federal spending by day since 2019. Cumulative spending so far in 2026 is second only to spending 2021, a year when the country was struggling to combat the pandemic. Total spending in 2025 — again, the first year of a term that began with a purported focus on cutting spending — was second only to 2021 spending according to Brookings data.

Earlier this week, we learned that the Pentagon is seeking an additional $200 billion to prosecute the war in Iran. That's $1 for every $8 spent to this date in 2025.

It's also just about exactly what "DOGE" claimed it had saved Americans through its ChatGPT-vetted cuts at the beginning of 2025.

Photo: Trump meets with Columbian President Gustavo Petro Urrego, Tuesday, February 3, 2026. (Flickr/White House)

Visualizing the erosion of American democracy

Democracy is measurable.

Imperfectly, I’ll admit, but it is still possible to evaluate the extent to which nations reflect democratic values over time. Free and fair elections, systems of checks and balances, commitment to free expression: these are principles that are present or are not, systems that may be implemented in part or universally.

The Varieties of Democracy project at the University of Gothenburg has done this measurement for more than a decade, establishing a consistent metric that allows for comparisons between and within nations and determinations of how democracy has changed over time.

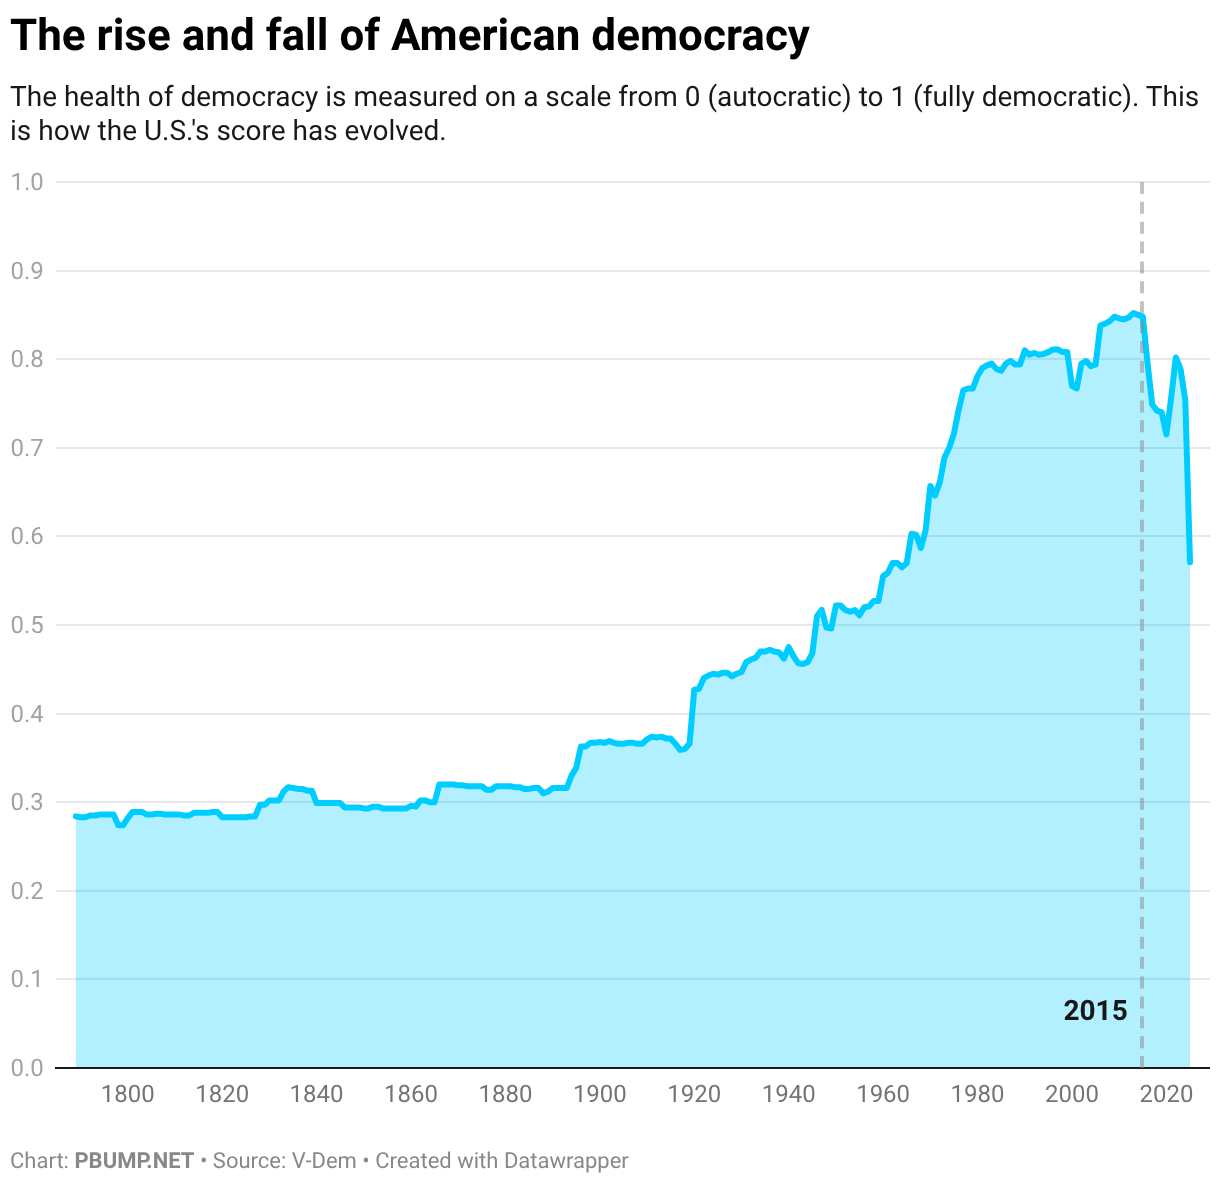
On Tuesday, its most recent data, covering 2025, was released. And what it determined was that measures of democracy in the U.S. slid backward dramatically during the first year of Donald Trump’s second term.

This will not be surprising to hear, no doubt, nor would it be surprising to anyone who understood how the nation’s democracy slipped the first time he was president. But the erosion was still dramatic, finding that America’s adherence to democratic principles had dropped to levels not seen since before the Voting Rights Act was passed.

In fact, it was one of the most dramatic single-year drop in modern history. The United States, according to this measure, no longer counts as a liberal democracy.

Before we explore how this change occurred, it’s worth contextualizing the U.S. globally. American democracy is still more robust than most other countries, including neighbors like Mexico. But while democracies in Europe have also seen backsliding, the extent of the U.S.’s recent shift is exceptional.

Click to view larger version.

That said, the international trend since 1960 has generally been toward greater democracy — or, at least, stasis. Along with the U.S., some democracies in Europe have similarly seen erosions that function as an erasure of the past 60 years.

Click to view larger version.

If we look at the last century, we can see how American democracy improved and then eroded. A slow upward increase and, suddenly, a downward spike.

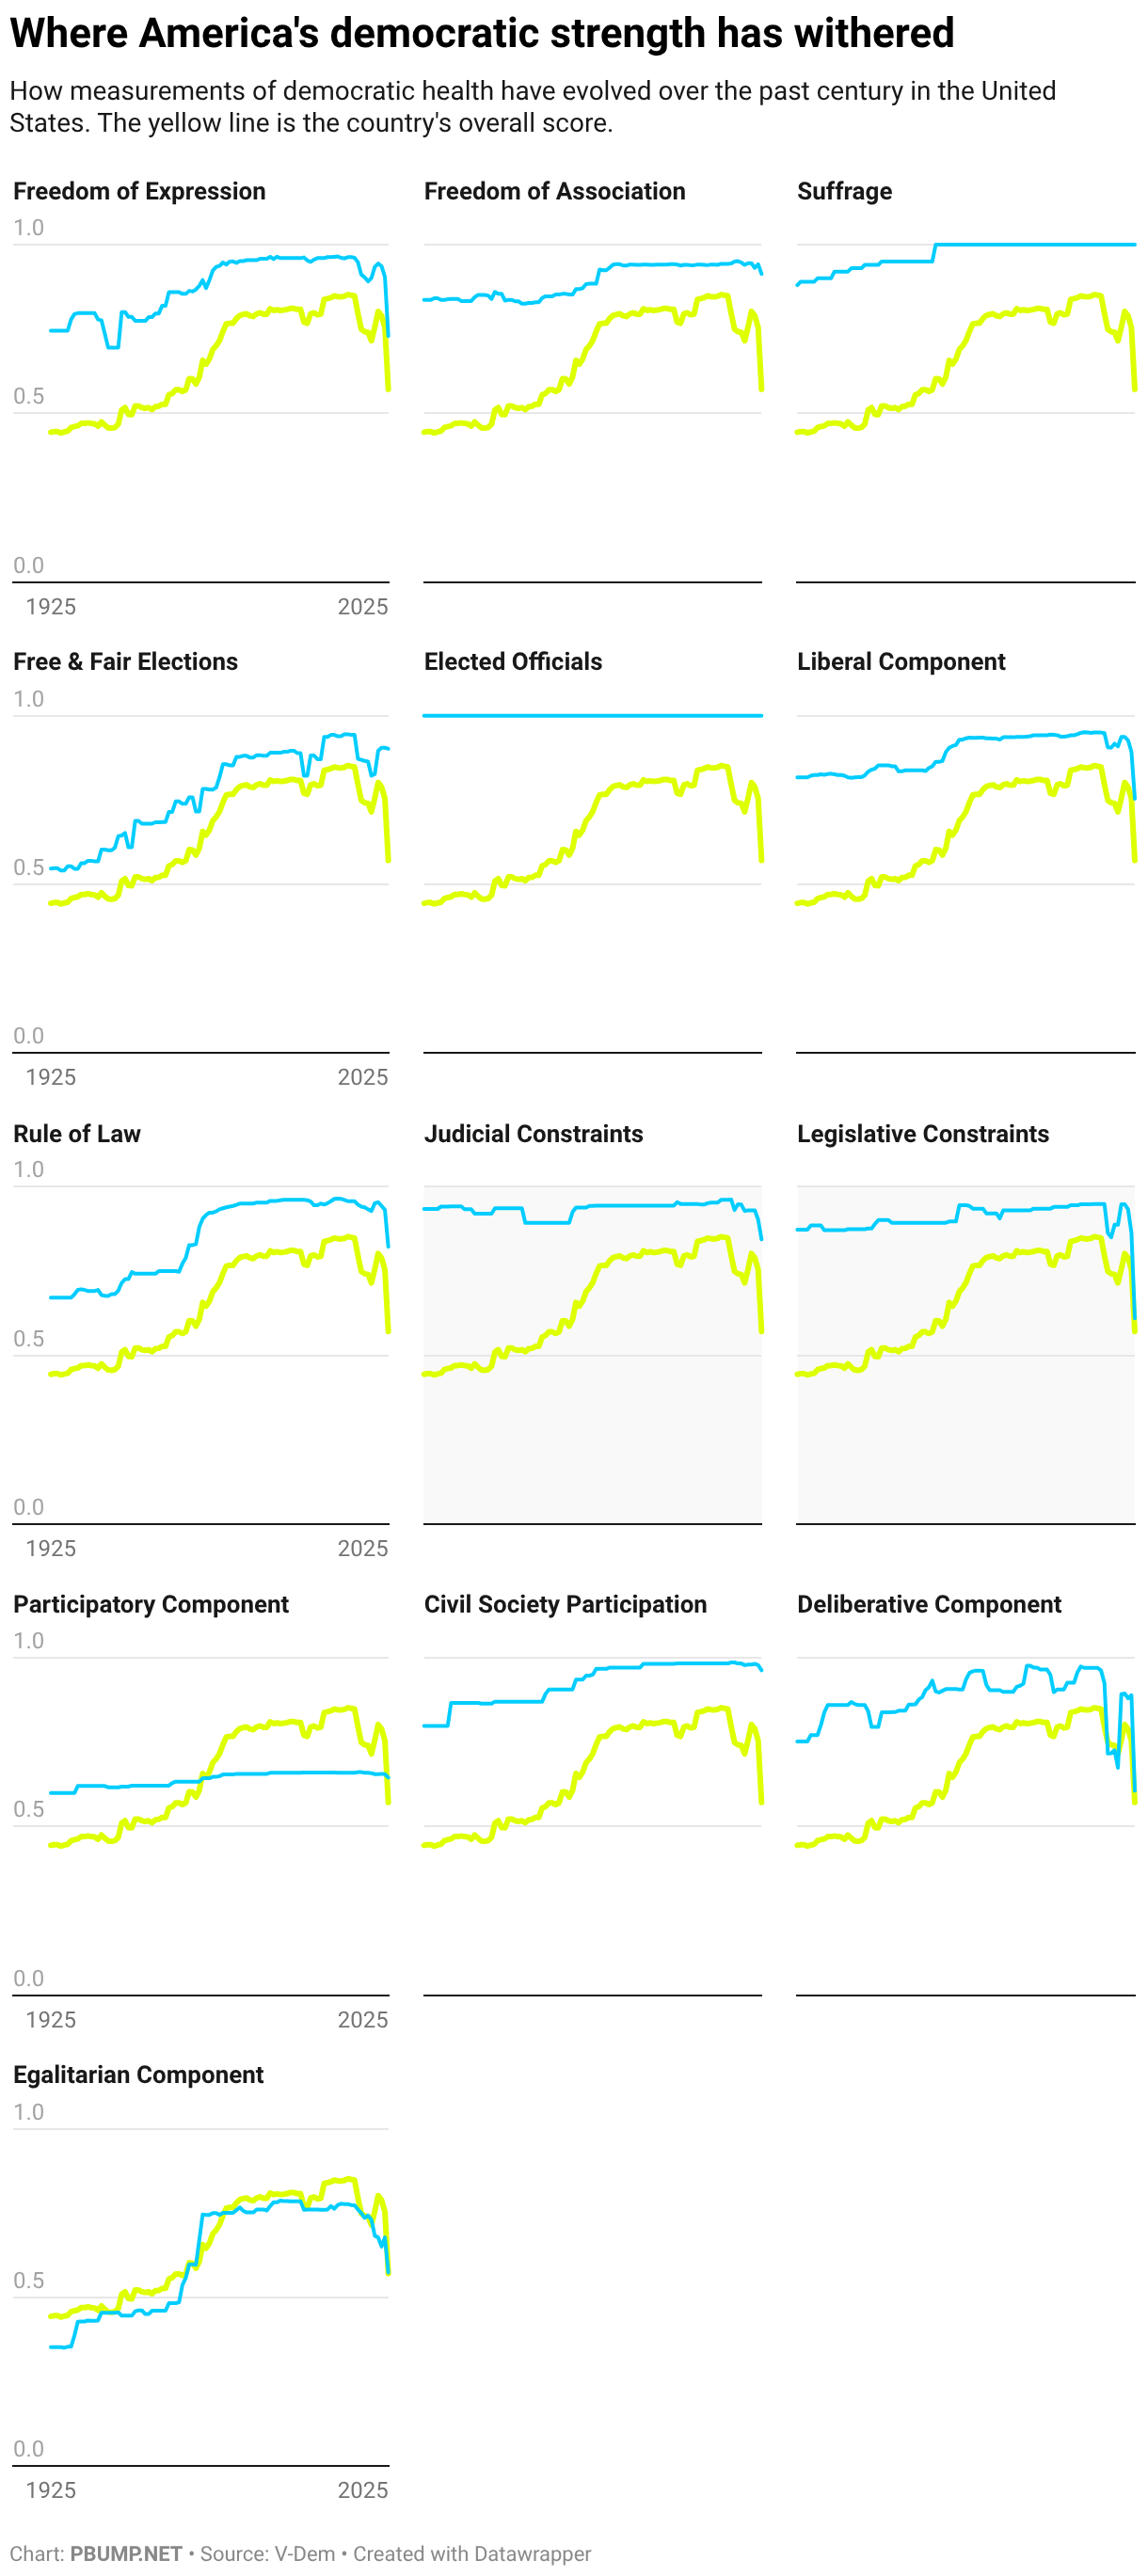
(The meaning of the category headers in this and the next chart are explained below.)

Notice the measures of judicial and legislative constraints that I highlighted above. This is an assessment of the effectiveness of checks on presidential power. Judicial constraints faded, thanks in part to the Supreme Court’s broad willingness to facilitate Trump’s seizure of power. The constraints of the legislature — meaning Congress — all but collapsed.

There are other noticeable shifts, too, that we can see when we zoom in to the last 10 years. The decline in freedom of expression, the drops in rule of law and egalitarianism: each of these has been obvious, particularly in the past 12 months, but it is still striking to see depicted so explicitly.

If there is a silver lining here, it’s that the U.S.’s score rebounded (modestly) once Trump left office. Institutions stiffened. Guiderails were (also modestly) mended. Backsliding is neither inevitable nor irreversible.

If, however, you are more interested in how much more empty the glass can get, consider the other aspects of democracy that we know are under attack. How will the measure of free and fair elections shift the next time V-Dem conducts its analysis?

It’s a reminder of another consideration. The U.S.’s rating fell in 2017, 2018, 2019 and 2020 — each year of Trump’s first term. He has almost three more years left in his second.

Photo: The president receives a hat. (Flickr/The White House)


The categories that contribute to the measurement of democracy:

  • Freedom of Expression. Whether the press, citizens, academics, and cultural figures can speak and publish freely without government censorship or retaliation.
  • Freedom of Association. Whether people can form political parties, join opposition movements, and organize civil society groups without restriction or harassment.
  • Suffrage. The share of adult citizens legally entitled to vote in national elections.
  • Free & Fair Elections. Whether elections are conducted without fraud, voter intimidation, vote-buying, or violence that distorts the result.
  • Elected Officials. Whether the head of government and the legislature actually reach power through popular elections rather than appointment or other means.
  • Liberal Component. Whether individual and minority rights are protected against overreach by the state or the majority, through civil liberties, independent courts, and checks on power.
  • Rule of Law. Whether laws are applied transparently and equally to everyone, and whether citizens have access to justice, property rights, freedom of movement, and physical security.
  • Judicial Constraints. Whether the executive respects court rulings and constitutional limits, and whether the judiciary operates independently from political pressure.
  • Legislative Constraints. Whether the legislature and oversight bodies can meaningfully question, investigate, and hold the executive accountable.
  • Participatory Component. Whether citizens engage in politics beyond just voting — through civil society organizations, direct democracy mechanisms, and elected local and regional governments.
  • Civil Society Participation. How robustly citizens organize and engage: whether CSOs are consulted on policy, how active and independent civic life is, and how inclusive political participation is across groups.
  • Deliberative Component. Whether political decisions are driven by reasoned public argument and appeals to the common good, rather than emotional manipulation, narrow interests, or coercion.
  • Egalitarian Component. Whether rights, political access, and economic resources are distributed equally across social groups regardless of class, gender, or group identity.

Here’s where National Park material is under review

On Monday, The Washington Post reported on the progress being made toward sanitizing U.S. history.

Back in 2020, then-President Trump seized on the (longstanding but again salient) right-wing idea that accurately depicting America’s history on issues like race, native cultures and slavery constituted unacceptable criticisms of the nation. In his waning hours as president, his first administration released a proposed history curriculum that would strip out things that offered such criticisms — criticisms that he and his allies internalized as criticisms of themselves and American (read: straight and White) culture.

After returning to the White House (leveraging broad backlash against what has come to be pithily described as “wokeness”), Trump issued an executive order mandating that national parks and historic sites remove any material that “disparaged” the U.S. or showed “partisan ideology,” itself a pithy descriptor for anything that attends to past controversies or the contributions of those who don’t fit within the administration’s idealized American norm.

For its report, The Post relied upon a leaked spreadsheet of material flagged by the administrators of national historic sites. Across more than 160 sites, some 530 displays, films, publications and other presentations were identified as potentially running afoul of Trump’s mandate.

See for yourself. The map below includes each of the flagged items, positioned by site. Many are nondescript. Many appear to be good-faith efforts to comply with orders from above. Some are a bit more questionable.

NPS Sites with Flagged Content

National Park Service interpretive materials under review. From a leaked database.
163sites
534submissions
Content type
Site Details
Click a marker.

What’s missing here are the actual materials, images and files for which are included in the full, downloadable dataset. It’s simply a taste of how the censorship process is working — an overview of how the White House and the president are hoping to strip American history of the bits they find frustrating.

Photo: The First Lady’s inaugural gown is given to the Smithsonian. (White House/Flickr)

Actually, lots of people understood Bad Bunny

If you wanted to make a surefire bet on the Super Bowl, there was an obvious one: President Trump would complain about Bad Bunny’s halftime show. And so he did.

“The Super Bowl Halftime Show is absolutely terrible” etc. etc., his social-media post began. And: “Nobody understands a word this guy is saying, and the dancing is disgusting” etc. etc. and “This ‘Show’ is just a ‘slap in the face’ to our Country” etc. etc. etc. etc. etc. etc. You could have had a pretty easy parlay on the inclusion of certain complaints.

In general, this moaning isn’t worth paying attention to. But there is one element of the complaint that’s worth calling out for its ridiculousness: the one about how “nobody” understood what Bad Bunny was saying.

He was speaking Spanish. And while perhaps no one at the White House or Mar-a-Lago speaks Spanish, lots of people in America do.

According to the Census Bureau, about 78 percent of U.S. residents only speak English at home. But about 1 in 8 speak Spanish.

Despite how central race is to Trump’s politics, it’s useful to remember that many of those who speak Spanish in the U.S. live in states that Trump won in 2024. In fact, almost half of them do.

In fact, four of the six states with the highest percentages of Spanish speakers voted for Trump in the most recent election.

Notice that I didn’t include U.S. territories. Puerto Rico, where Bad Bunny was from, is home to about 3 million more Spanish speakers — Americans, whether Trump likes it or not.

Plus: Millions more people watch the Super Bowl around the world. Two years ago, more than 24 million people in Mexico tuned in. I’m guessing most of them were able to figure out what Bad Bunny was saying.

It’s admittedly silly to rebut this point, in part because I’ve invested about 15 minutes thinking about something that Trump considered for less than 15 seconds. It’s just culture-war stuff, an effort to stoke his base’s sense that something is changing in a way that makes them feel uncomfortable. In a way that makes him feel uncomfortable.

The results of 2024 notwithstanding, it’s a safe bet that politicians who appreciate Bad Bunny’s performance are better attuned to the present (and future) than are politicians who portray a Spanish speaker as bizarre or threatening.

Update: I probably shouldn’t have tried to do this in the middle of the Super Bowl. Used the wrong column for one of the maps, so the numbers were off. It (and some text) has been corrected.