The votes-per-acre paradox

One of Donald Trump’s favorite places in the country is Sweetwater County, Wyoming. Not because there’s anything in the county that’s particularly compelling beyond its natural beauty. No, Trump likes Sweetwater County (even if he couldn’t name it) because it is 1) very large and 2) voted for him by more than a 50-point margin each time he ran for president.

In other words, Sweetwater County is one of the largest splotches of red on the maps of election results that Trump likes to wave around in the Oval Office. Only about 41,000 people live there, but it punches above its weight in making the U.S. look much more red than it actually is.

There is an established (and, for some time, strengthening) link between population density and voting. More urban areas vote more heavily Democratic; more rural, more heavily Republican.
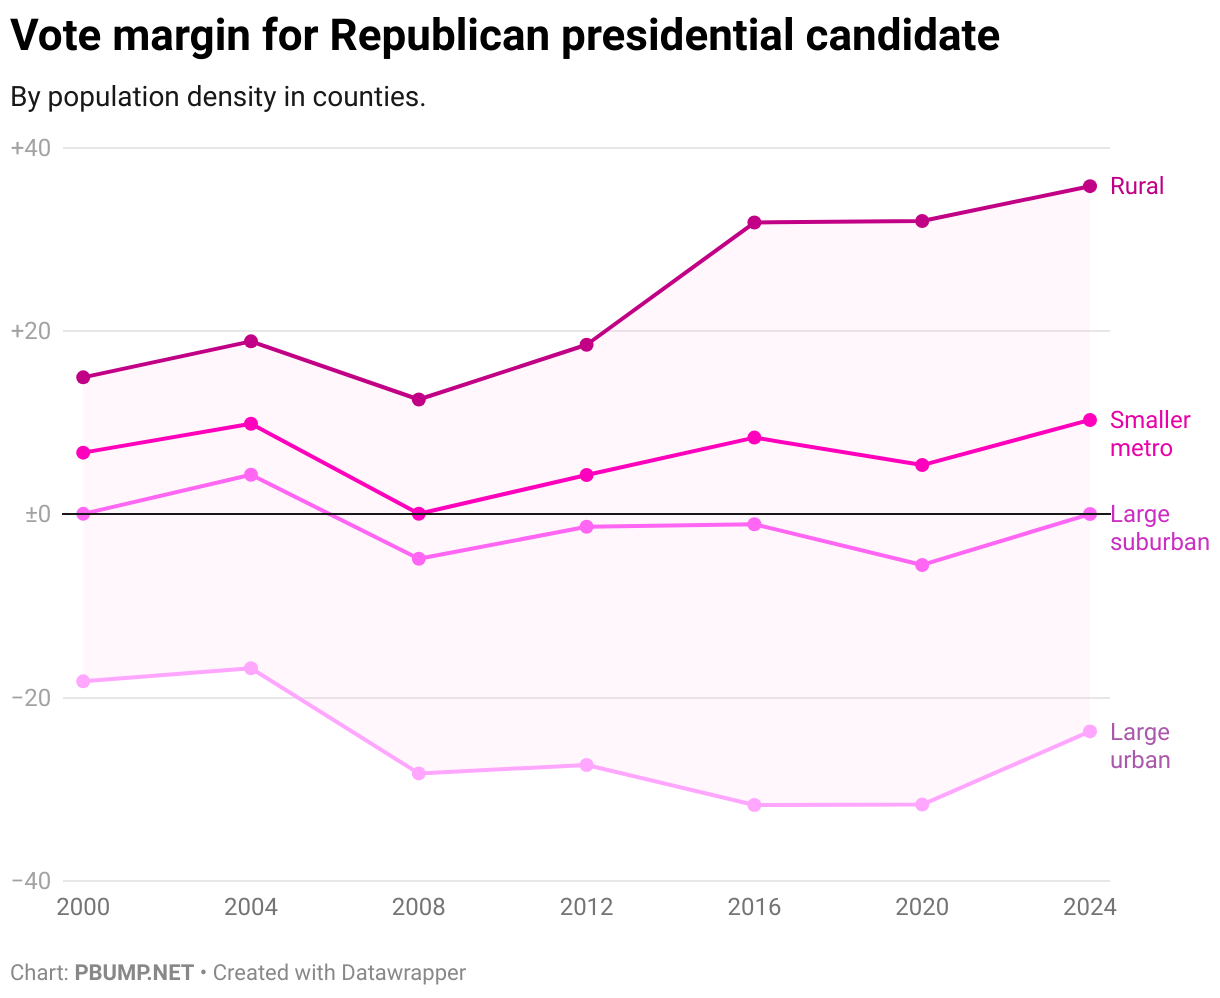
The gap between the most urban and the most rural counties narrowed slightly in 2024 but, relative to 2012, it’s still yawning.

One might assume, as I did, that this means that comparing vote counts to the land area in which voting takes place would mean that the average number of square miles (or, as the charts below indicate, square meters) is lower for Democratic voters in denser parts of the country than it is for Republicans.

Using precinct-level data from 2016, though, we see that, averaged across states, it isn’t. On the chart below, dots below the line indicate an average square-meters-per-voter that’s higher for Hillary Clinton voters than it is for Trump voters in that state. And, as you can see, that’s the case for nearly every state.
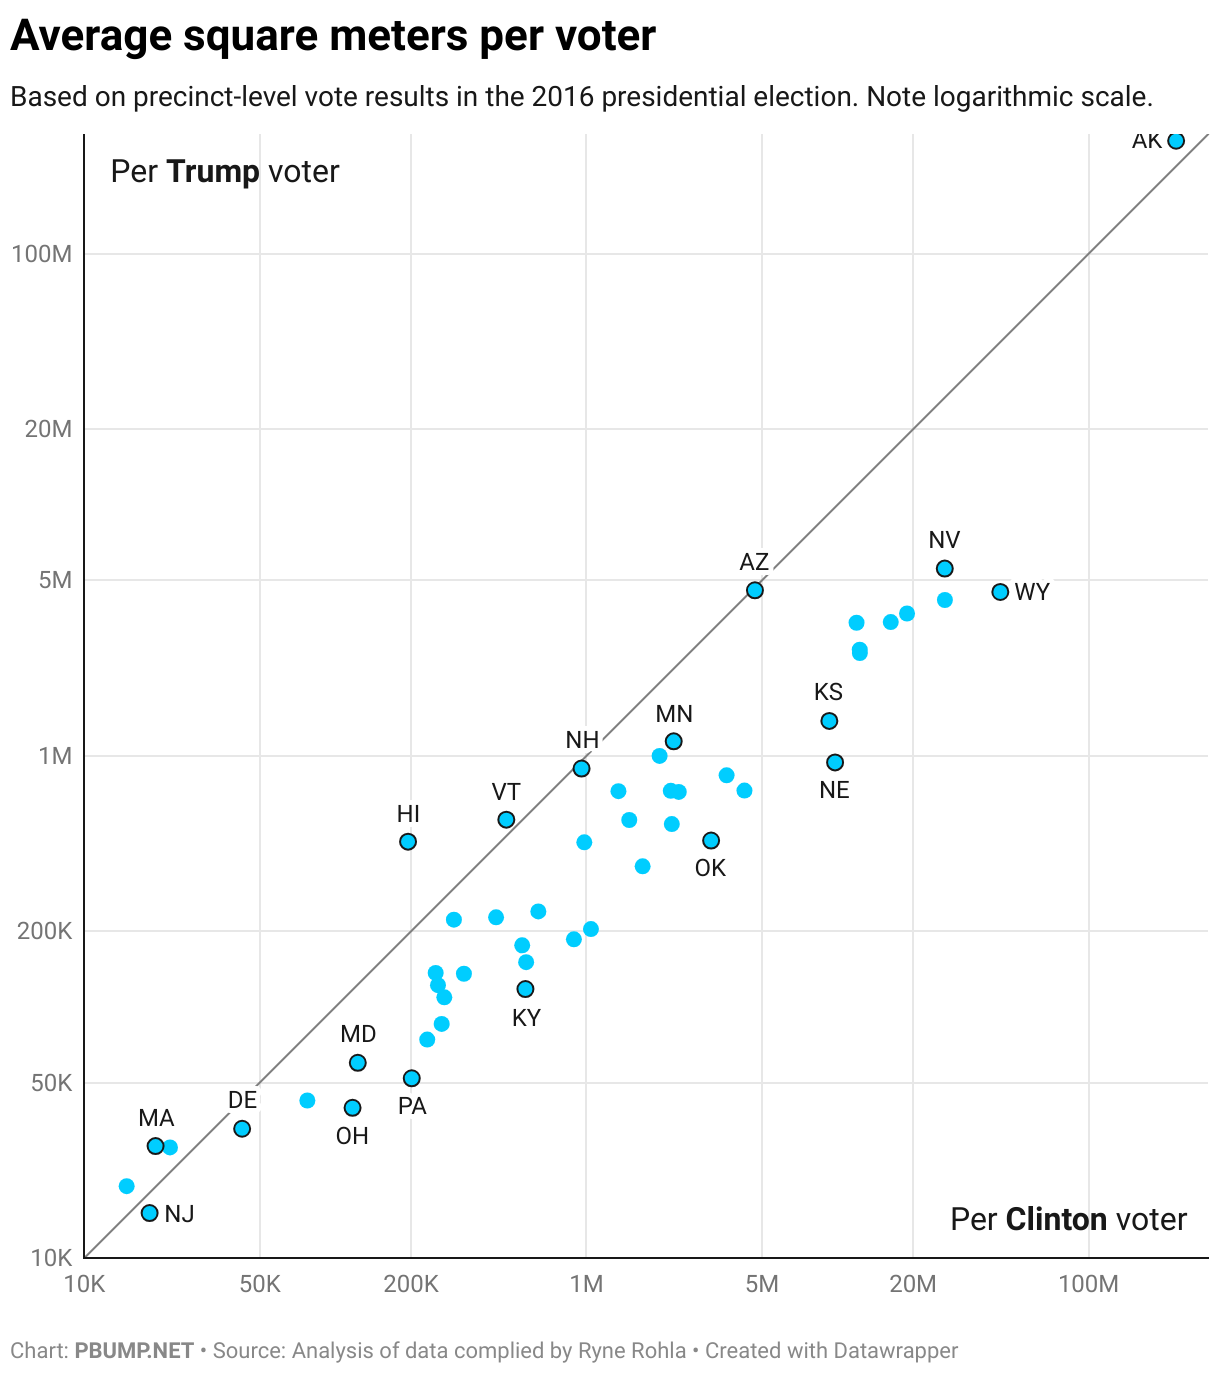
If we use median square meters rather than average, the picture is slightly different. States with lower median square-meters-per-voter tended to see more square meters per Trump voters than Clinton. States with higher square-meters-per tended to see more square meters per Clinton voters.
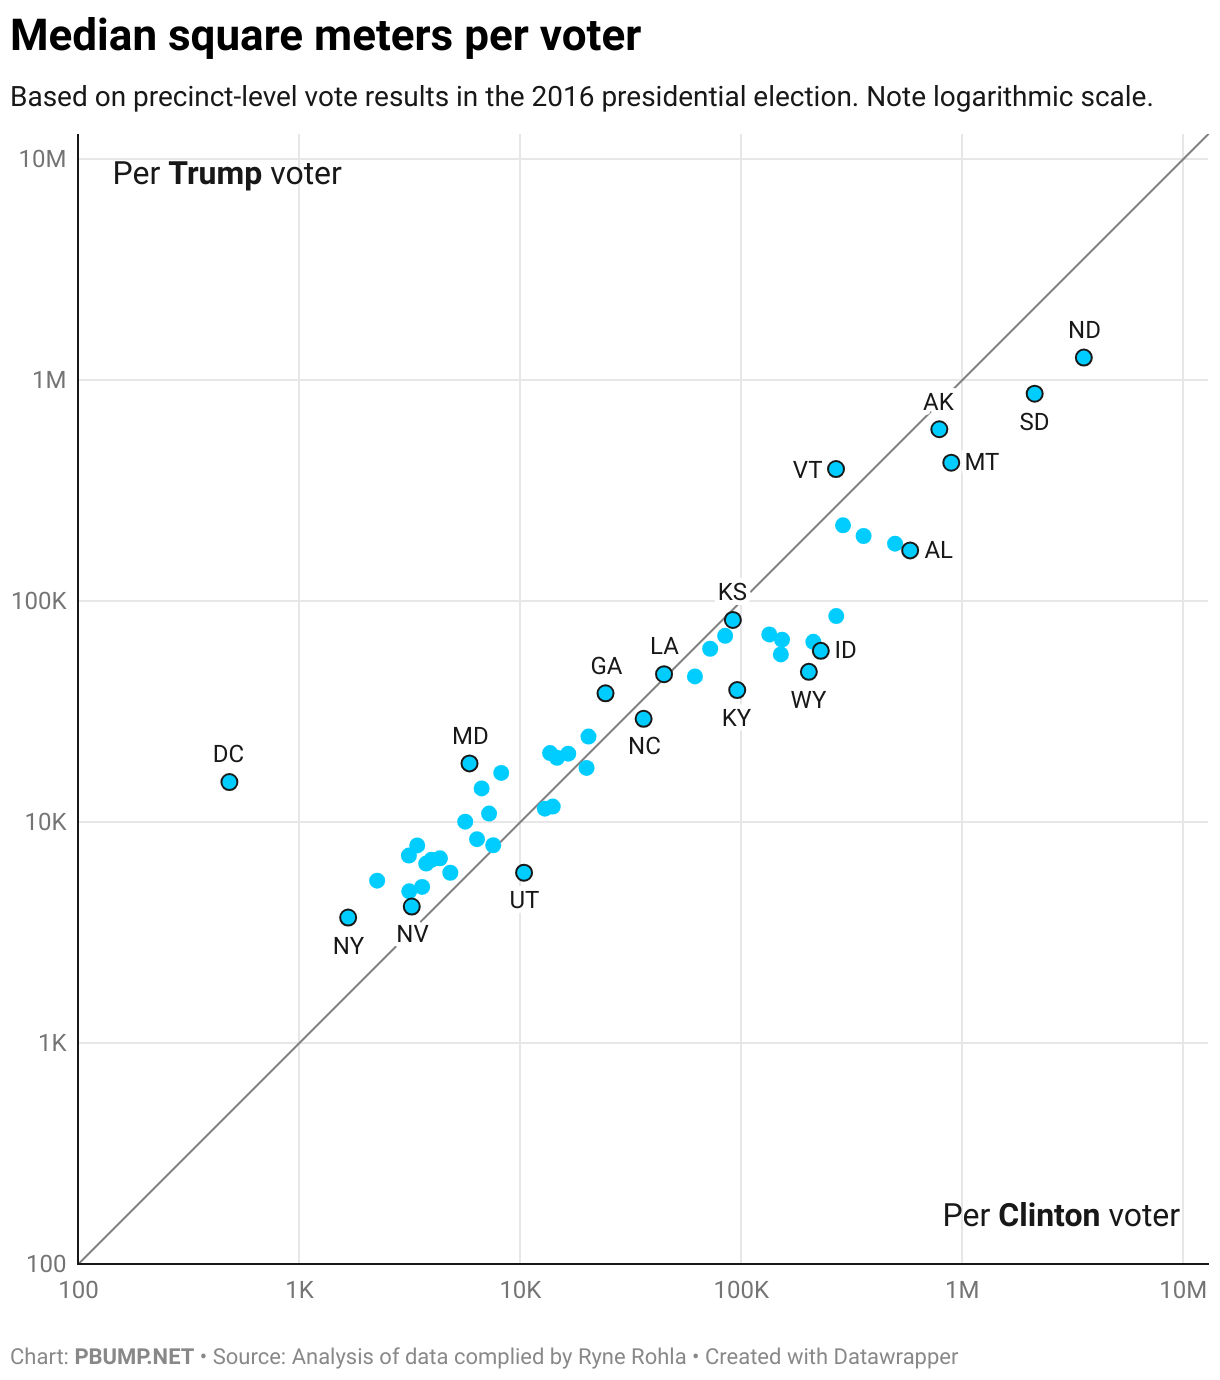
You’ll notice that most of the lower square-meters-per-voter values are in states that voted for Clinton. And that, it turns out, is most of the story.

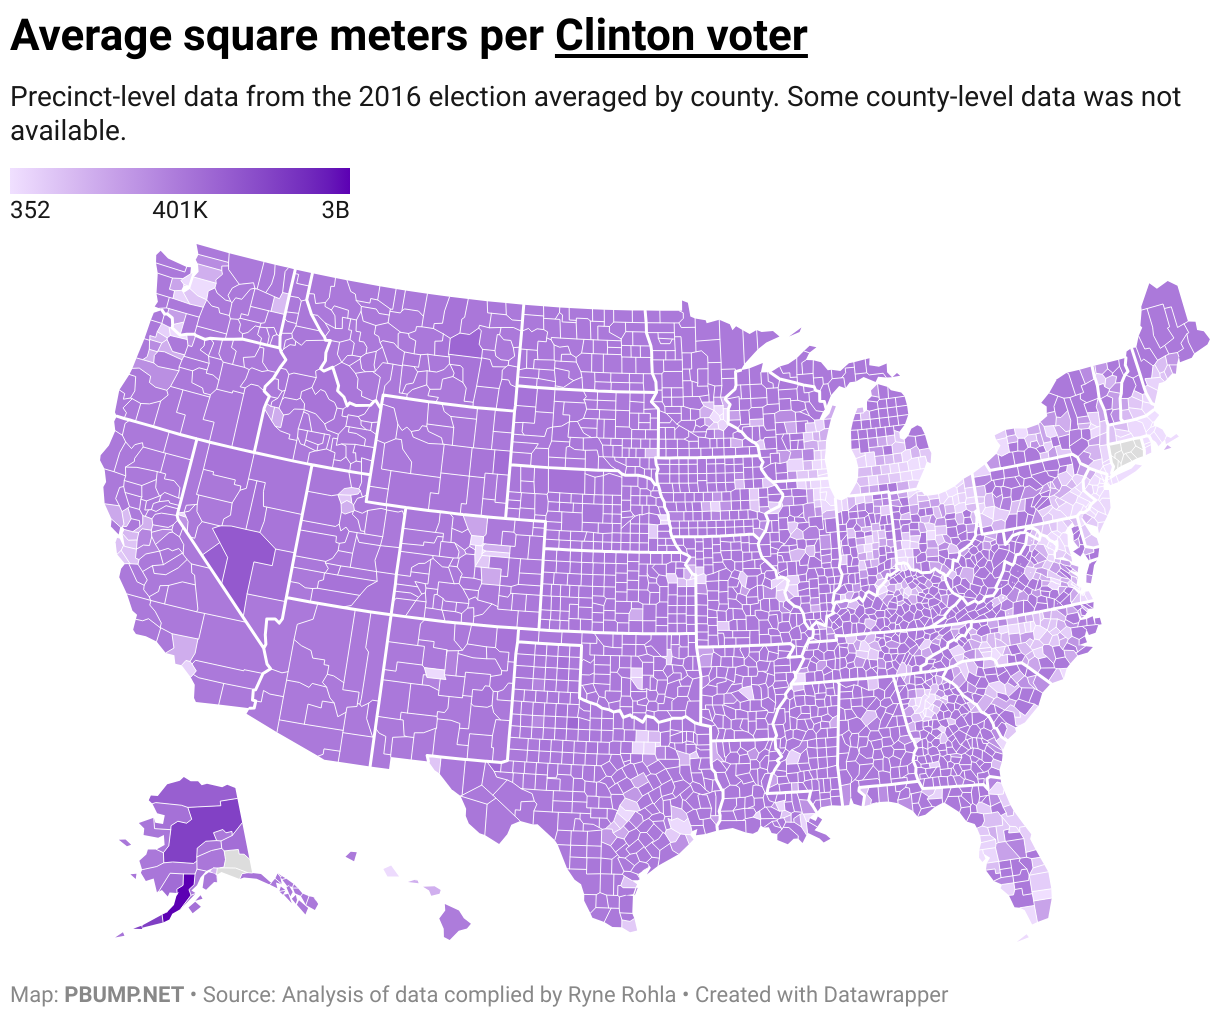
If we look at the average square meters per Clinton voter in individual counties, we see how urban areas stand out. They have lower square-meters-per-voter because there are more voters in a smaller space. In rural Nevada, there’s a much higher value — more space and fewer Clinton voters.
If we do the same analysis for Trump voters, we see a key difference: much more vote density in the areas around the cities that stand out above.
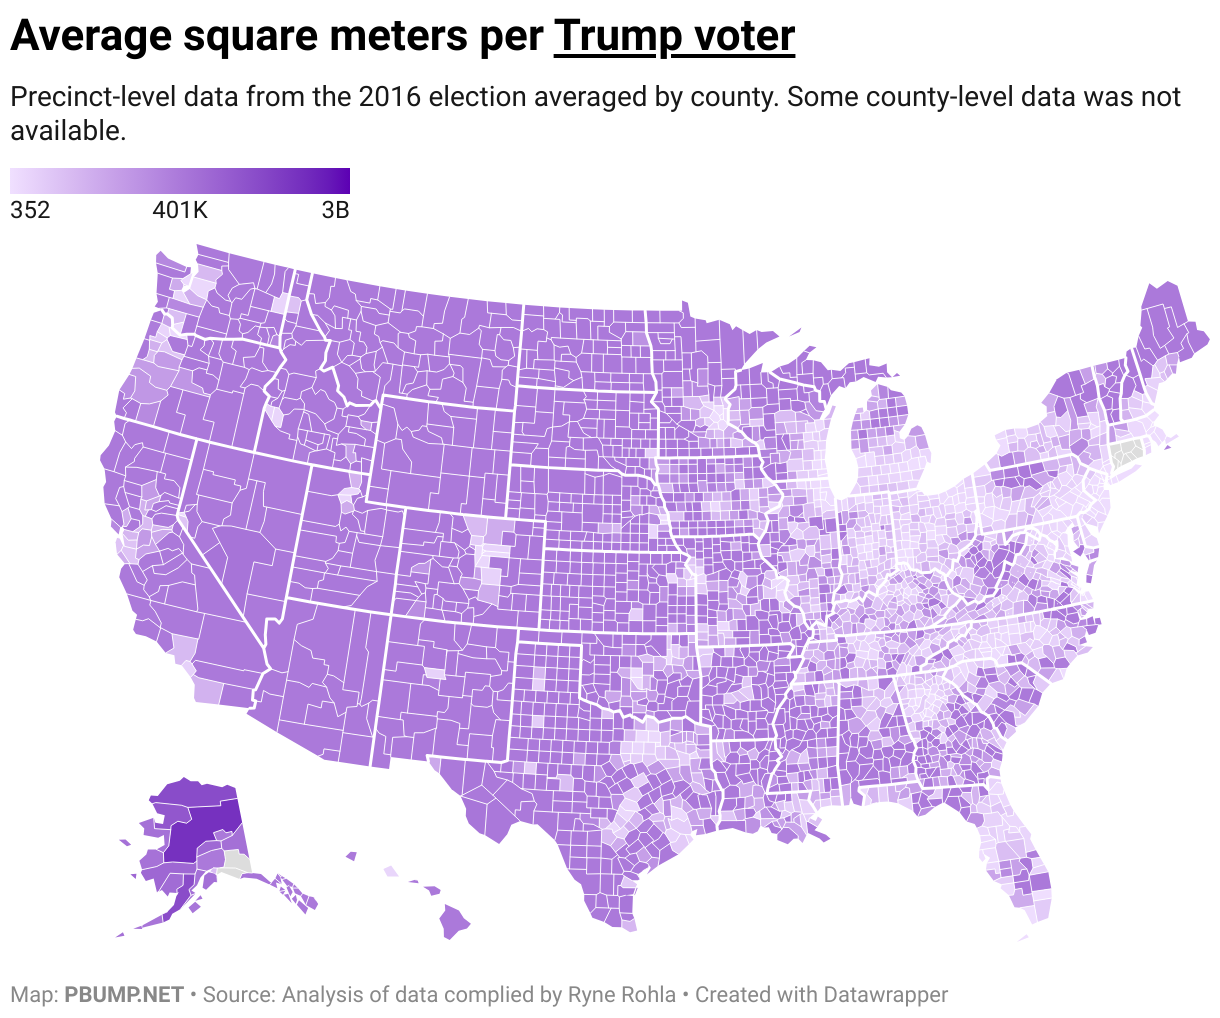
In other words: more Trump voters in the suburbs, increasing the denominator in our calculation.

Since Trump won more rural areas and Clinton won more urban ones, the ratio of area to votes spikes for the Democrat in places where she got blown out. In Sweetwater County, for example, there were 8.4 square kilometers per Clinton voter compared to 2.2 for each Trump voter.

If we look only at the averages in precincts each candidate won, the chart looks more like what I would have expected at the outset. In nearly every state, Clinton voters cast ballots from more densely-packed areas than did Trump voters.
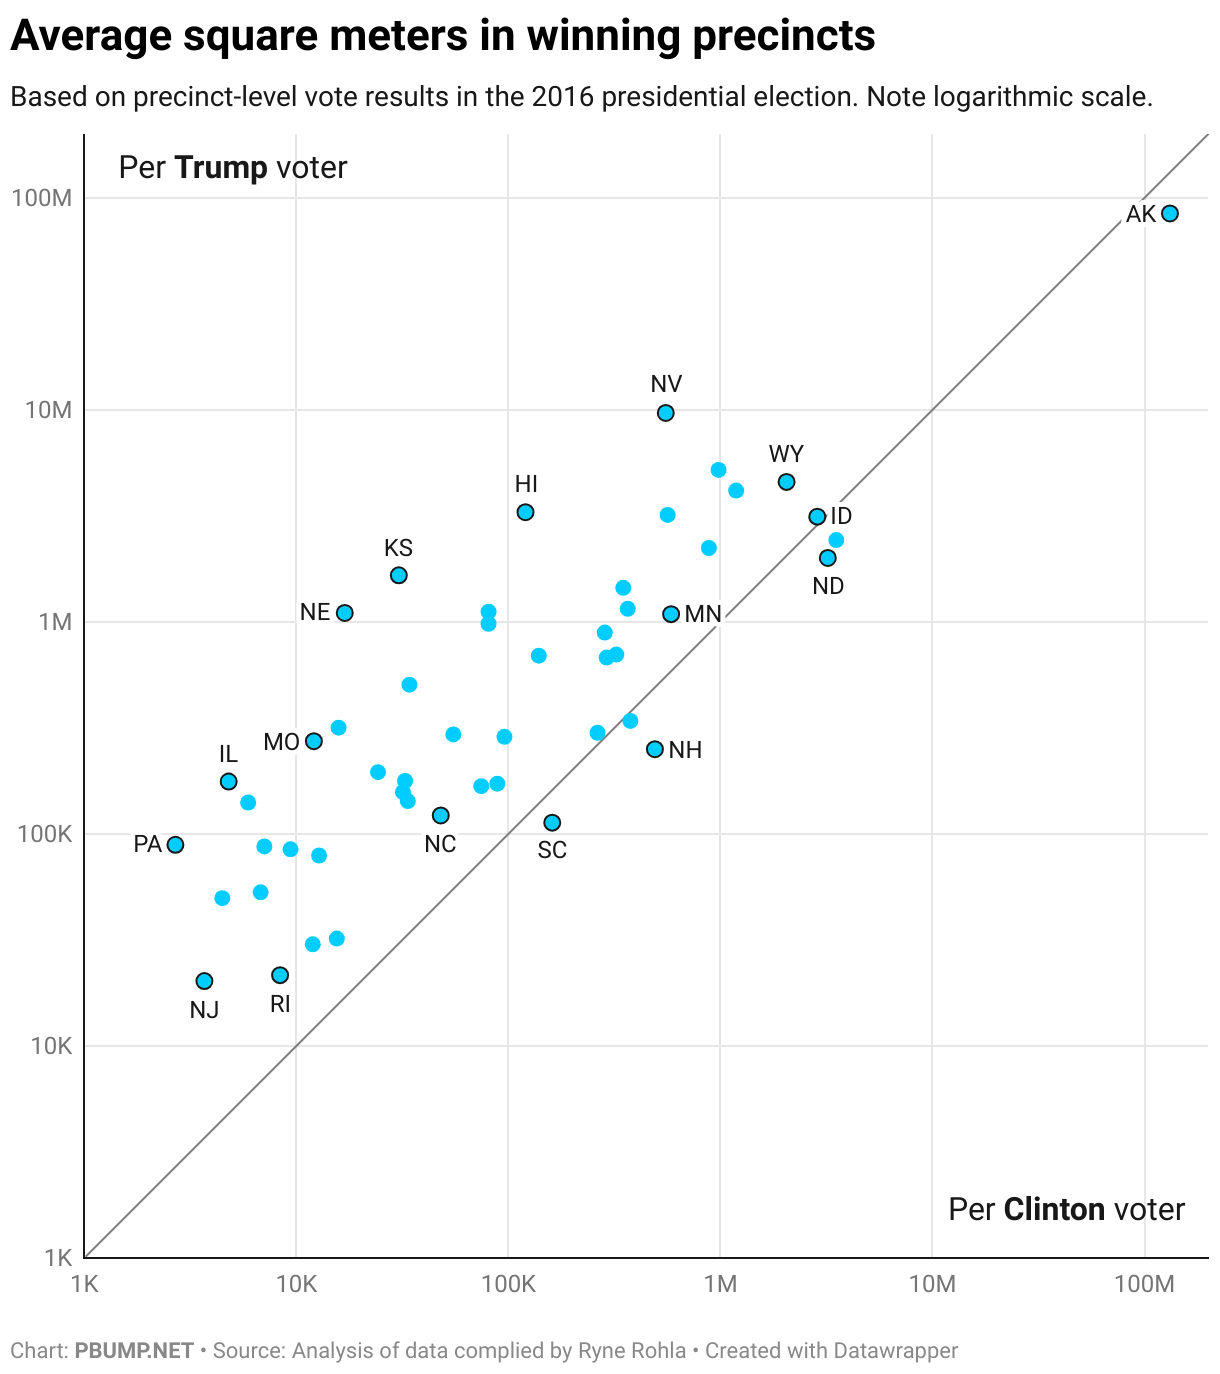
As I was mulling this over in the first place, I thought it would be interesting to see whether the understood correlation between population density and voting could be measured using these data. I reached an unsatisfying answer: Sort of.

Photo: Trump at a campaign event in 2020. (White House archive/Flickr)

A 79 year-old freshman senator would be … unusual

Maine Gov. Janet Mills (D) has announced her intention to run for Senate against the state’s well-known — ahem — incumbent, Susan Collins. When the next Senate term begins in January 2027, Collins will be 74 years old, well past the typical retirement age in the United States. But Mills will be 79 — well, well past the typical age at which one assumes a new, stressful job.

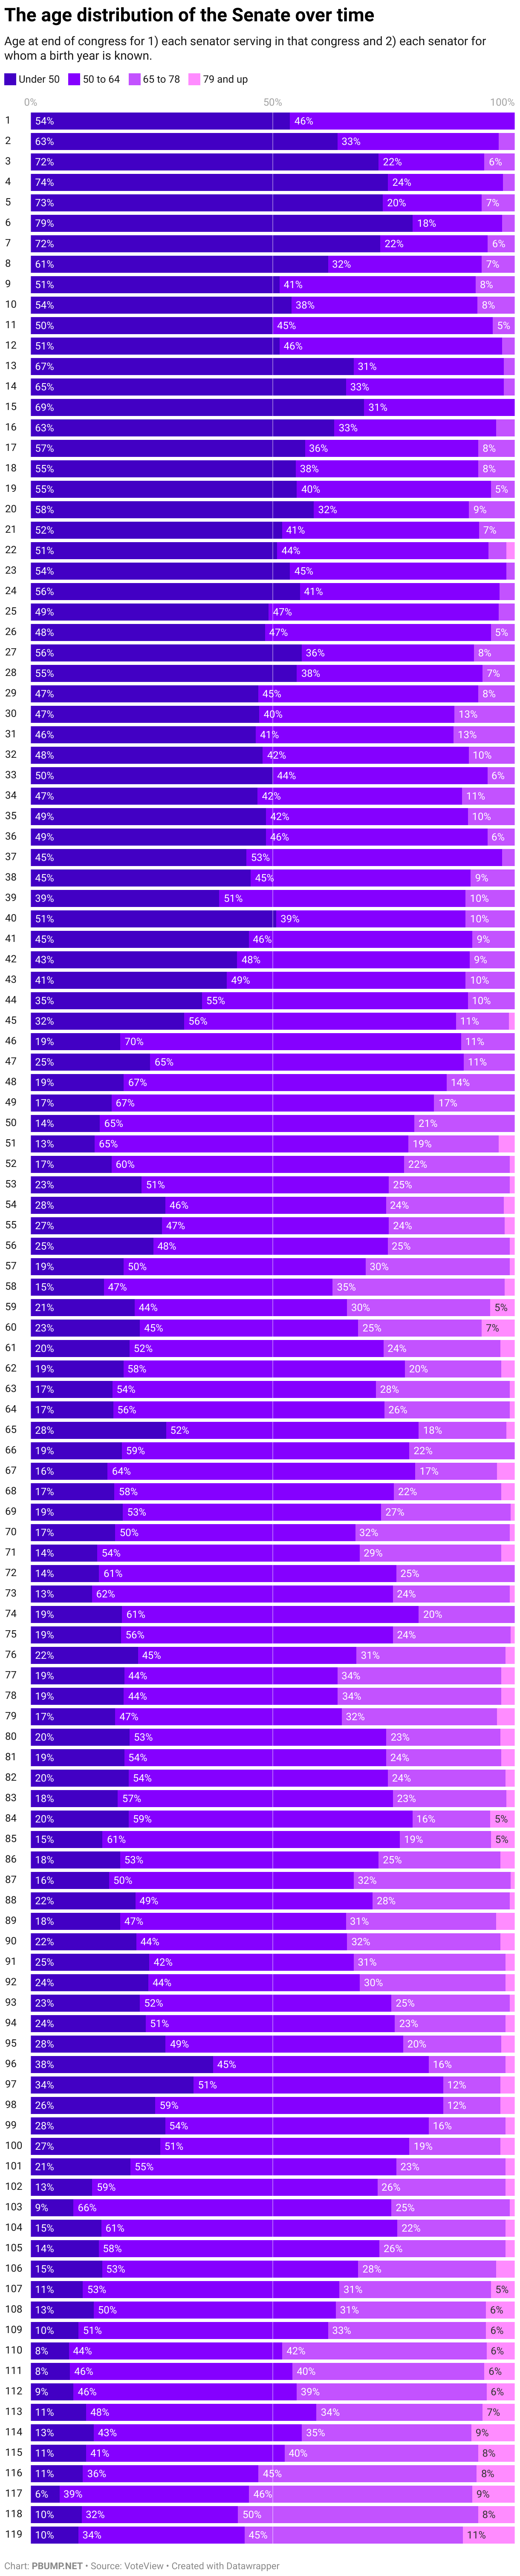
It used to be relatively rare for anyone as old as Mills would be to serve in the Senate at all, much less as a freshman. Until the 114th Congress (2015–2016), no more than seven senators served in a single congress who would have turned 79 by the end of the congress’s second year. Since the 114th Congress, though, there have been at least eight in each congress. The current, 119th Congress, has 11 senators who will be 79 or older by the end of next year.

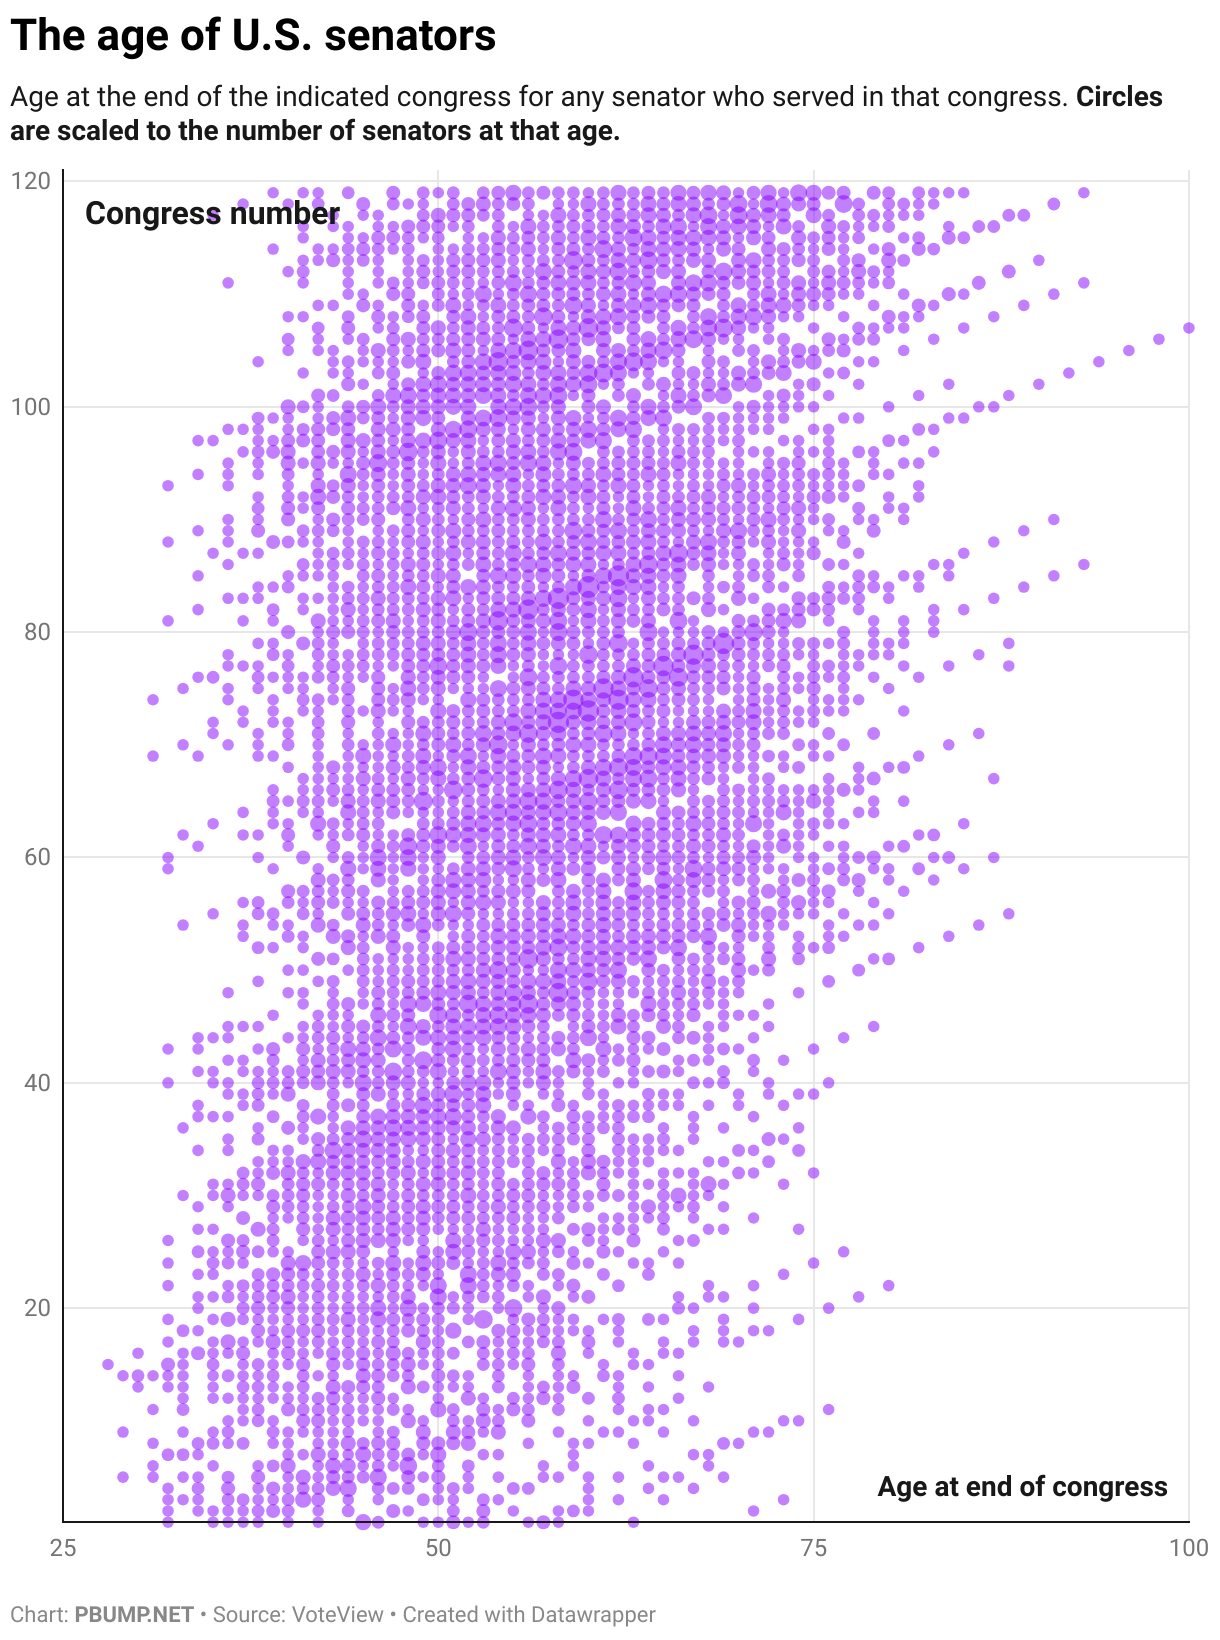
You can see on the chart below how the age of sitting senators has slid upward — as, of course, has the age of the American public.

There are some senators who stand out on the chart above. The series of dots that extends all the way to the 100 mark, for example, indicates Strom Thurmond, who served as a senator for nearly 1 in 5 years that the U.S. has been in existence.

Often, freshmen senators who were in their 70s and 80s were appointed to fill vacancies. The oldest new senator (according to my analysis of VoteView data), was Andrew Jackson Houston, appointed at age 86 to fill a vacancy. He started in April 1941. He died in June 1941.

By my count, there are seven freshman senators in U.S. history who would have been 79 or older by the end of the congress in which they first served. All but one, Isaac Stephenson, was appointed. Stephenson was elected, assuming office in 1907 at the age of 77 — more than a year younger than Mills would be.

Until the 1860s, almost or more than half of senators were under the age of 50. That hasn’t been the case since the congress that ended in 1868. Over the past five congresses, an average of just under 10 percent of senators have been under the age of 50. In the current congress, more than 10 percent will be 79 or older by the end of next year.

When Rep. Jerry Nadler (D-N.Y.) announced his intent to retire back in September, I suggested that the Democratic Party was slowly beginning to recognize its generational problem. It will be in part up to primary voters in Maine — given a choice between Mills and a 40-something challenger — to determine the extent to which the party’s base agrees that there’s a problem at all.

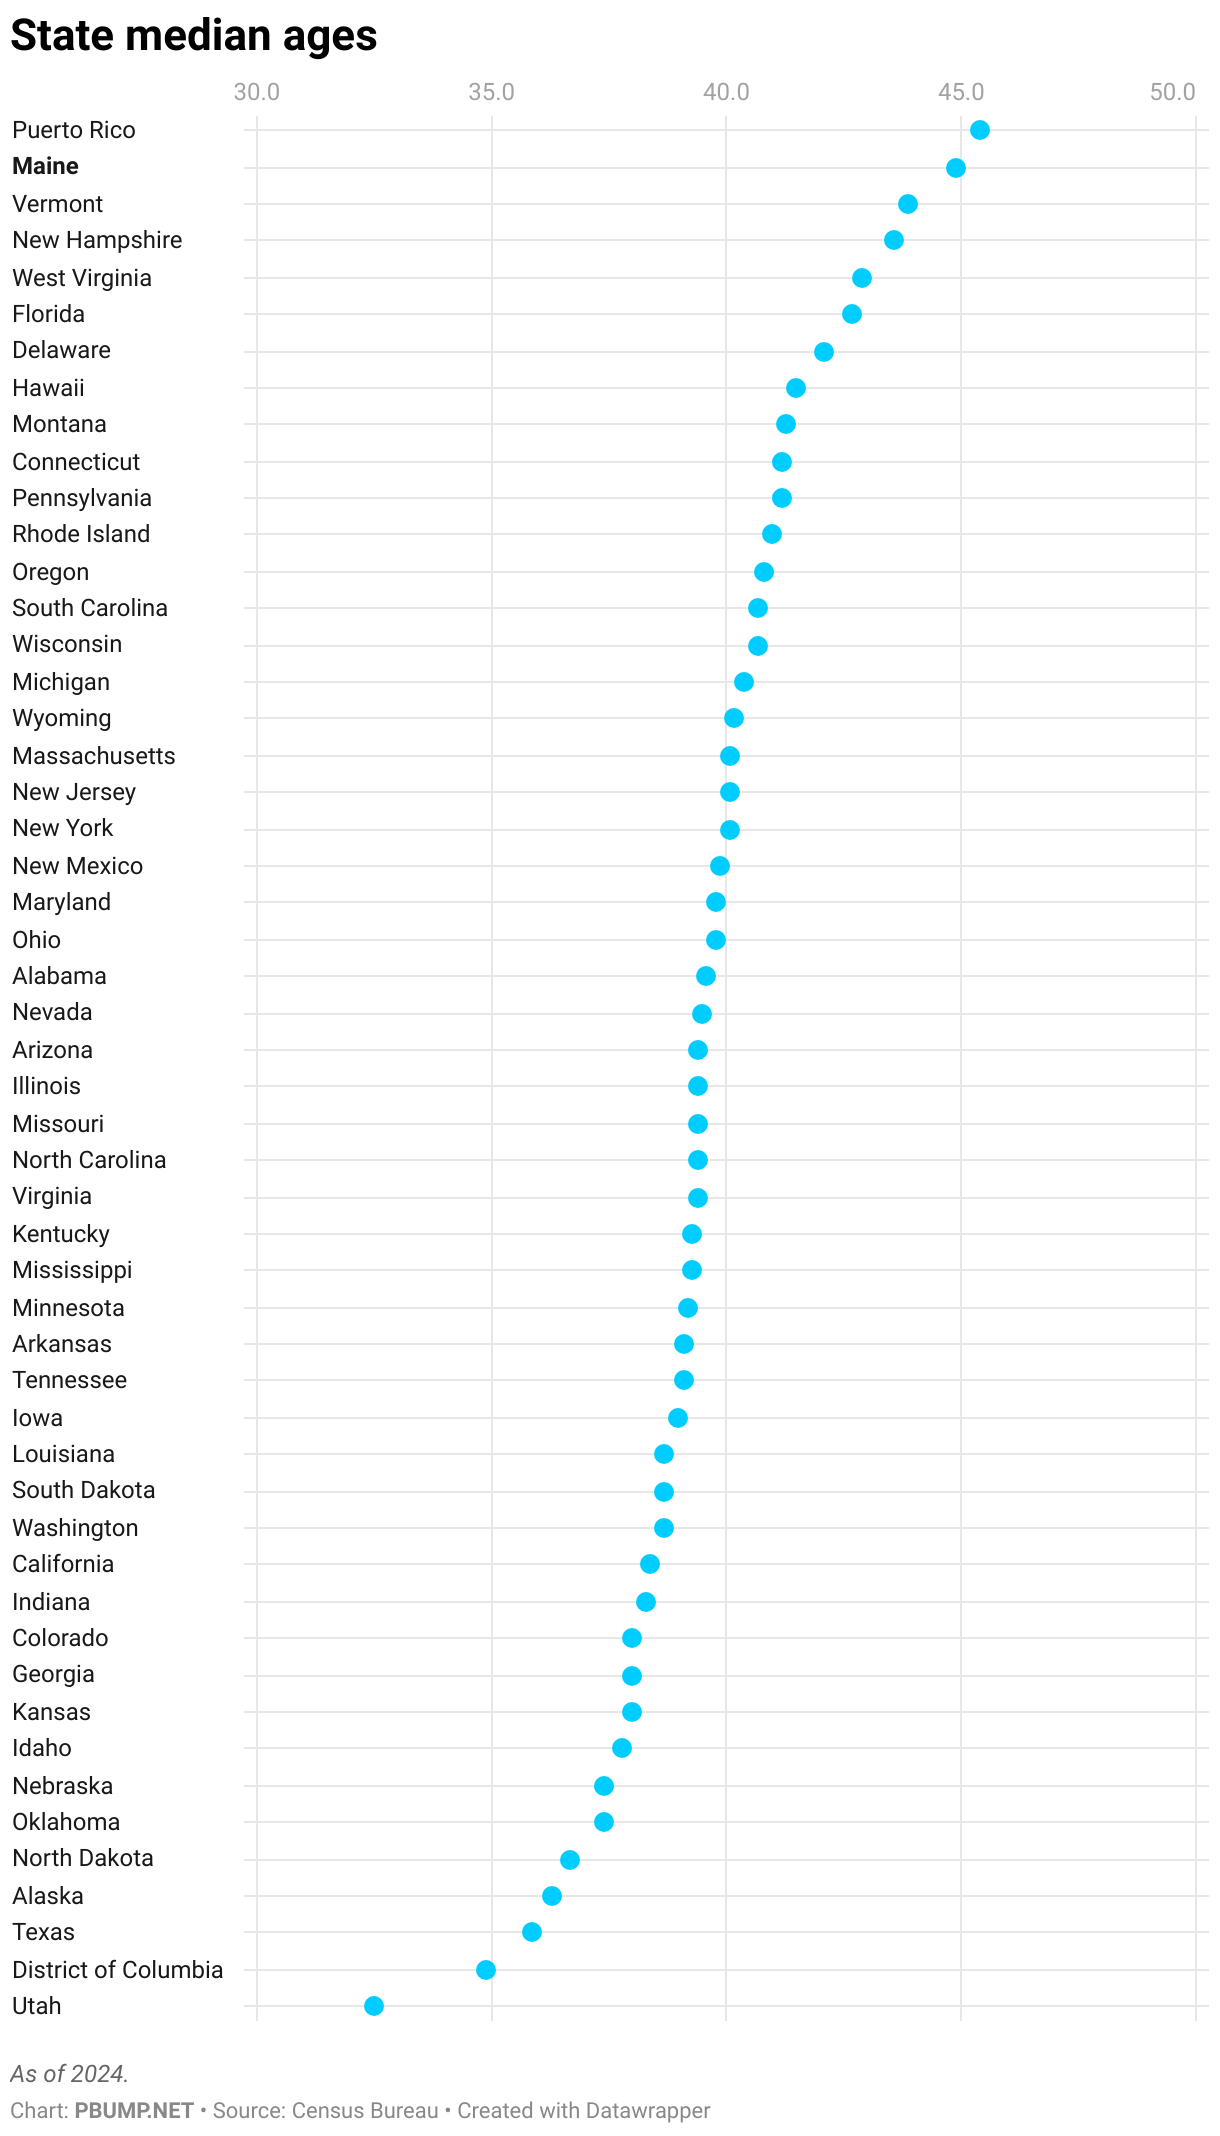
Given that Maine’s residents are the oldest of any state, they may not.

Photo: Ronald Reagan and Strom Thurmond in 1987. (National Archives)

Resolving the ‘Columbus Day’ fight

For years, the country has grappled with a difficult question: should we set aside a holiday to honor the man who accidentally discovered North America and its native inhabitants before willfully killing huge numbers of them? Some people say no.

This isn’t the actual issue, of course. Columbus Day has become a proxy for recognizing the contribution of Italian immigrants to the U.S., as seen in the documentary film “The Sopranos.” It’s less about Columbus than it is about recognizing a part of American culture — one that itself took a while to establish a foothold.

Still, though, Columbus’s was the precipitating event for a lot of native deaths. In 2021, President Joe Biden signed an executive order that accommodated that history, stating that Columbus Day (a congressionally authorized federal holiday) would also serve as Indigenous Peoples’ Day. And since Biden did that, this month Trump gleefully undid it, acting as though Columbus Day had been eradicated (which it hadn’t) and he was the salvation of Italian heritage.

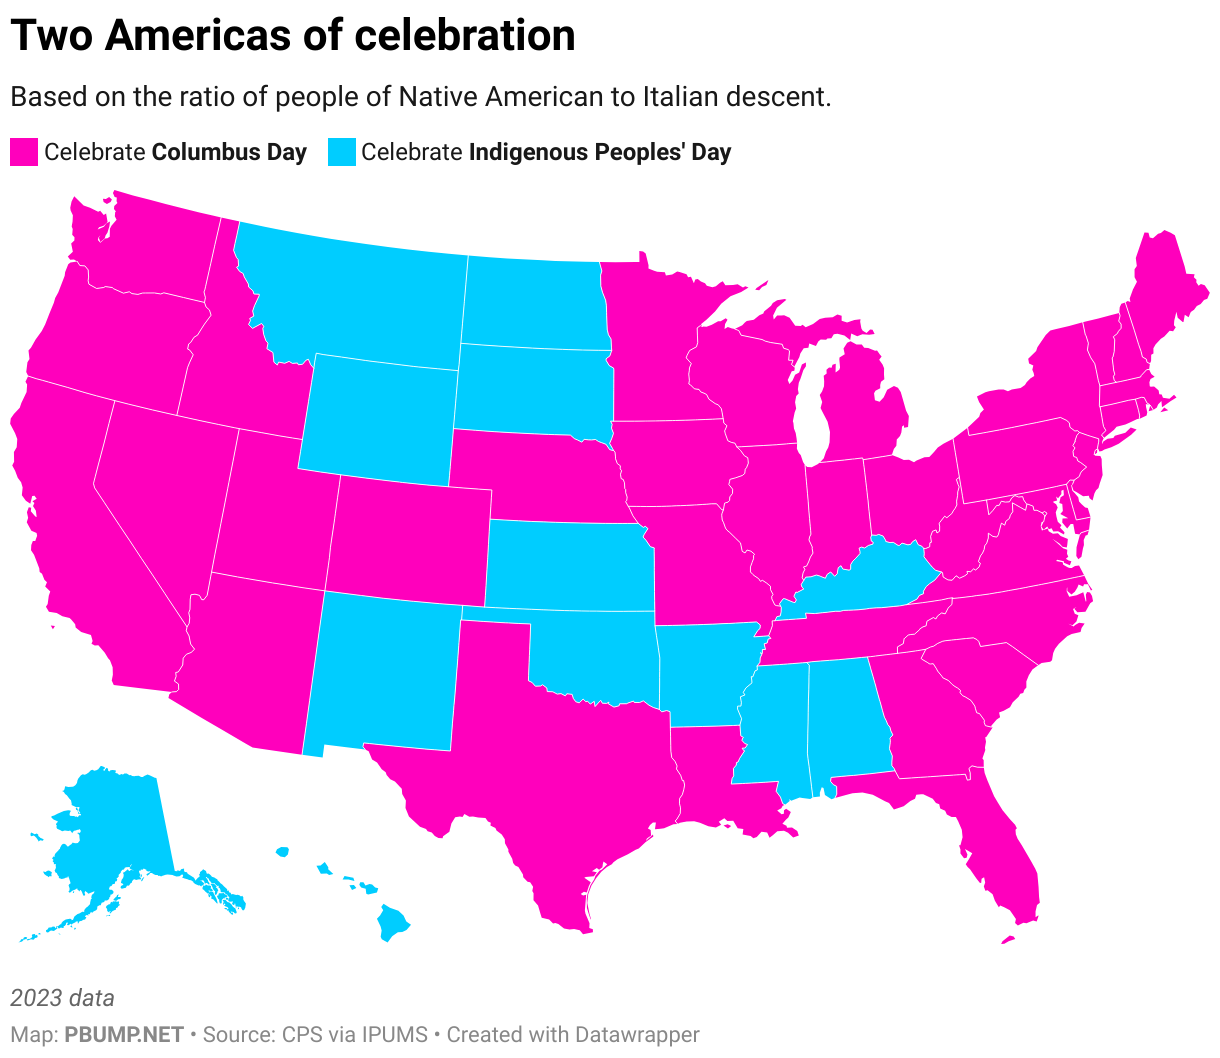
Given that history of tension, I am proud to offer a solution. The holiday will now be celebrated as a function of state populations, with states having a larger portion of residents of Native American ancestry celebrating Indigenous Peoples’ Day and states with more residents of Italian ancestry celebrating Spain’s most notorious contractor.

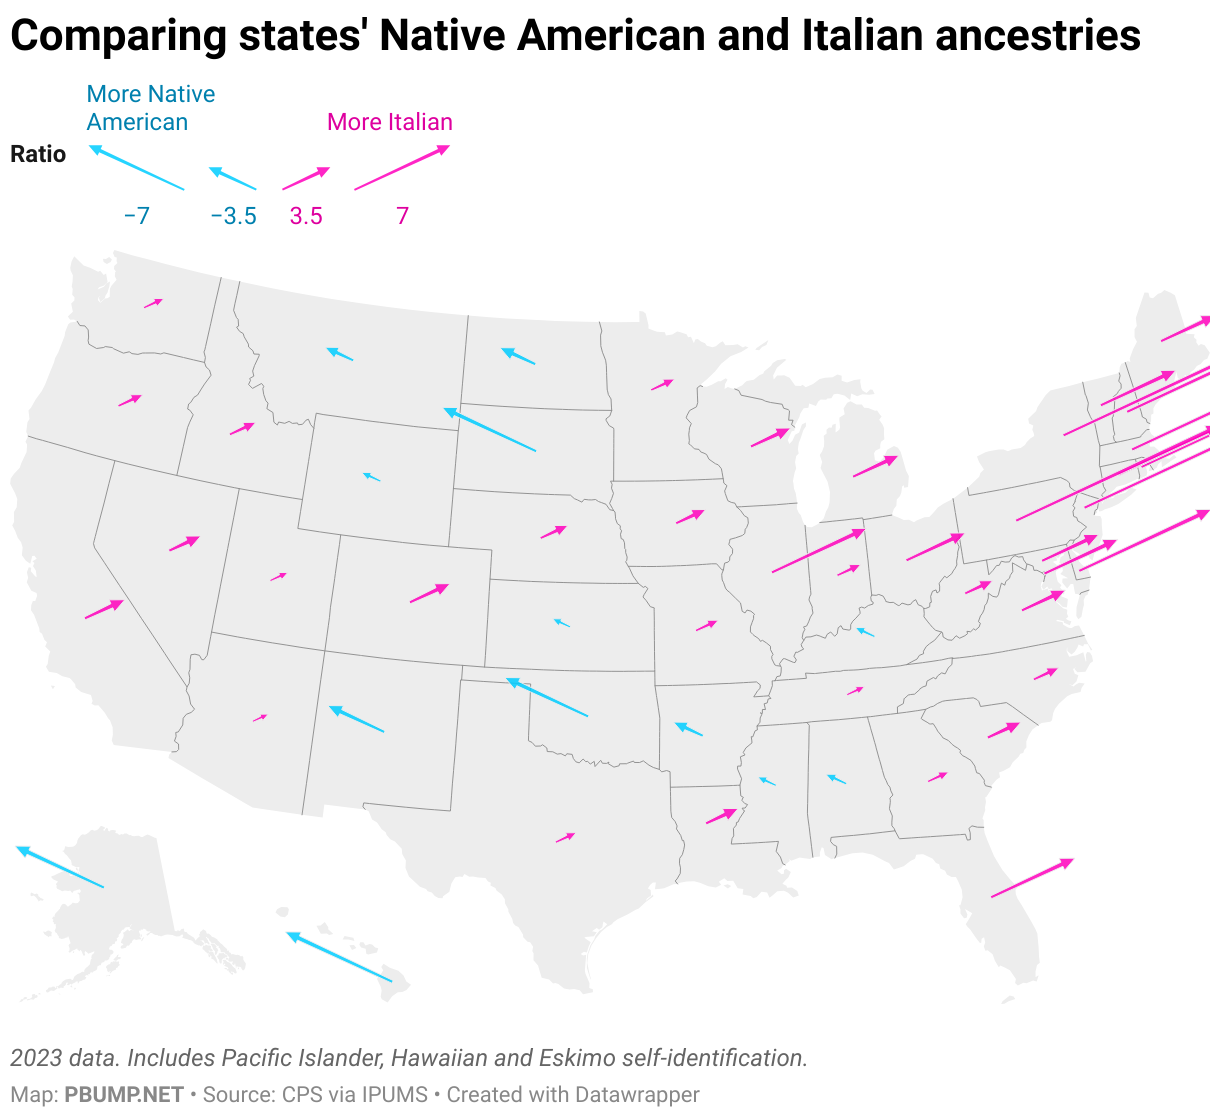
The Census Bureau collects data on ancestry. In the U.S., there are a bit under three times as many people who report Italian heritage as report Native American. The Native Americans are at a slight disadvantage, having been slaughtered so enthusiastically that it affected the climate, but that’s where we are.

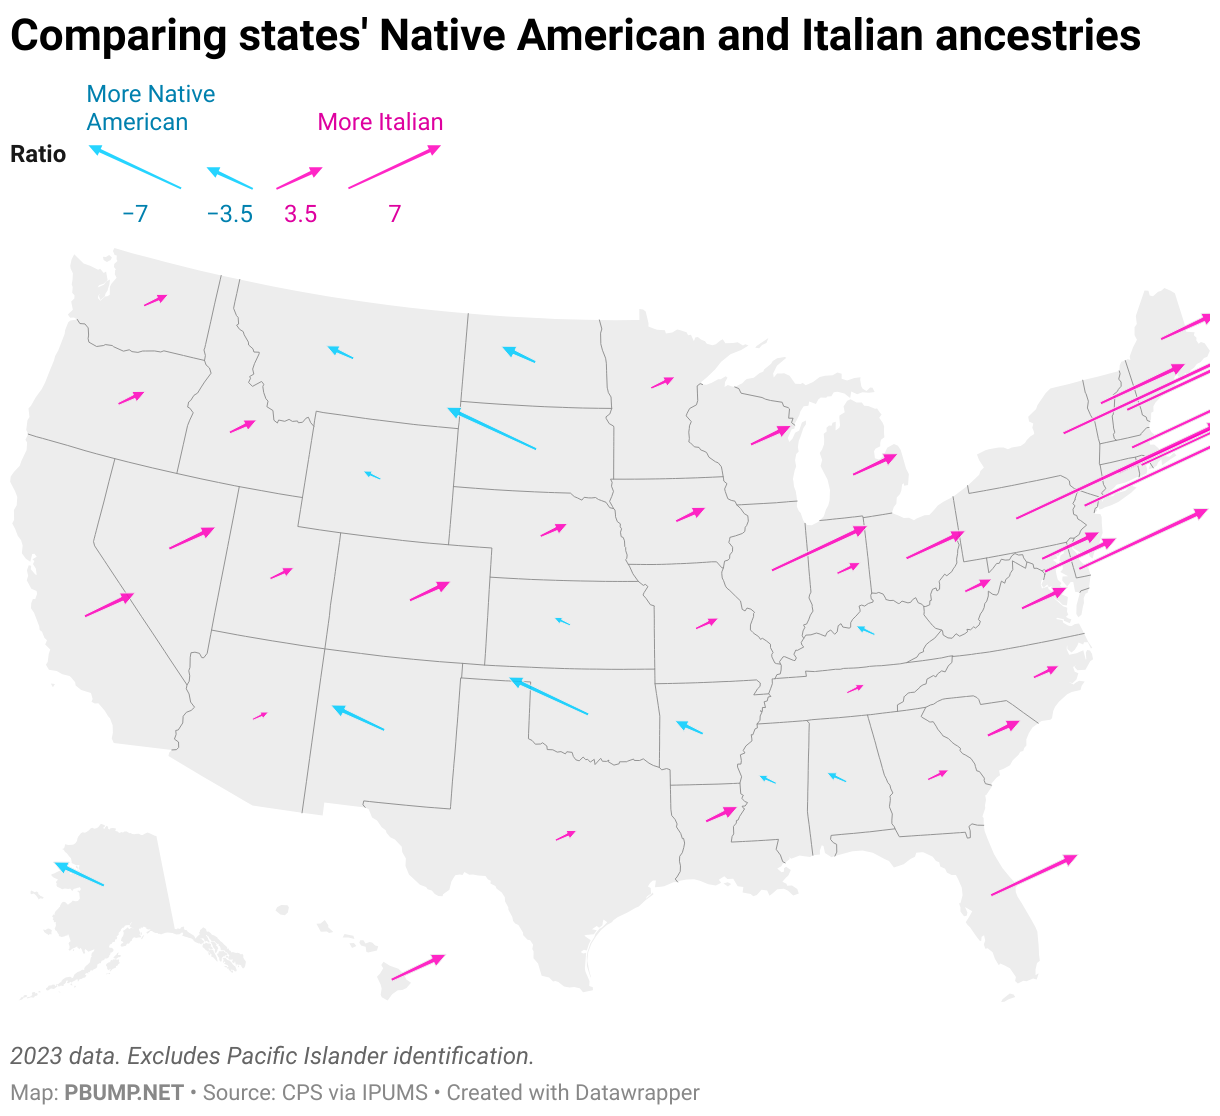
As noted, though, this varies by state. Some, particularly in the Northeast, have far more people of Italian ancestry. A few have more of Native American ancestry.

That map doesn’t include people whose ancestors were Pacific Island natives or identified as being of Hawaiian ancestry. If we add them:

The county-level data are limited, but within that limited set, the county with the biggest ratio of Native American to Italian ancestry is Coconino County, Ariz. The one with the biggest Italian to Native American is Morris County, N.J. — where several scenes from the documentary “The Sopranos” were shot.

Once the nation adopts my proposal for the holiday, here’s what will be celebrated where, at least until people move around.

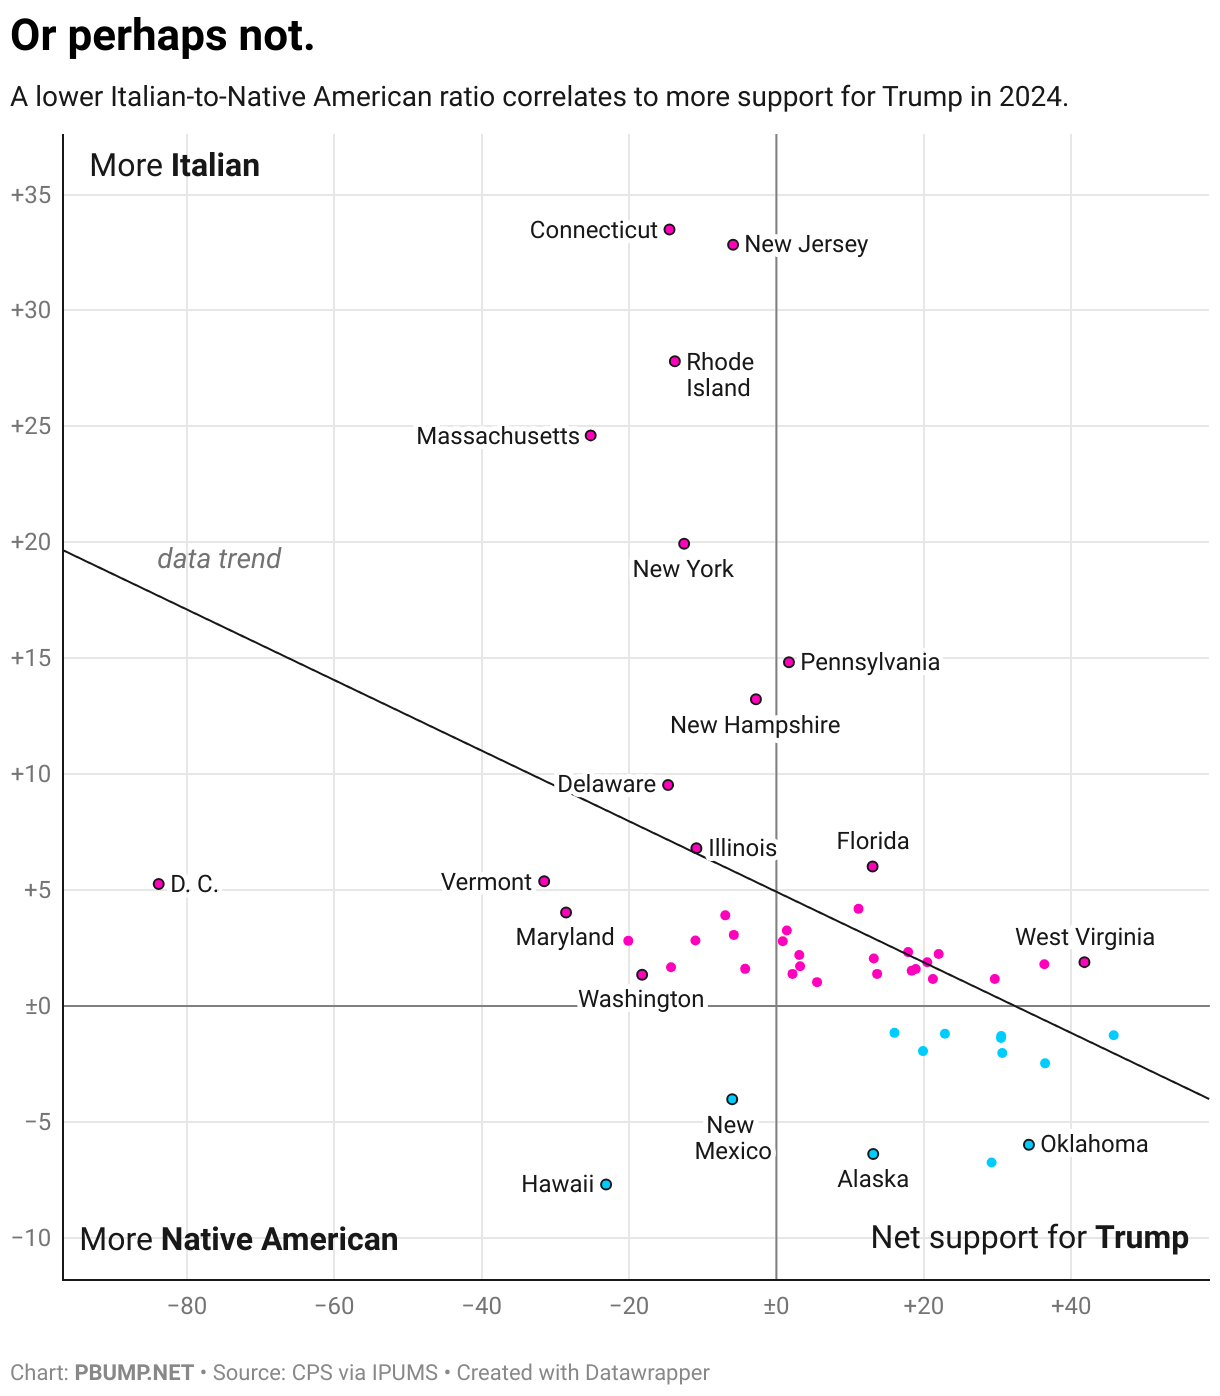
There is one problem with this plan, I’ll admit. There is a (relatively loose) correlation between the prevalence of residents of Native American ancestry and support for Trump in the 2024 election. Meaning that states that would celebrate Indigenous Peoples’ Day would be more likely to also support Trump’s presidency.

This, too, has at least some roots in the unhappy history of Native Americans. Oklahoma has a lot more people of Native American than Italian history not entirely because the Native Americans were hoping it would work out that way.

But, look. A solution is a solution. I look forward to a bipartisan Capitol Hill coalition embracing and implementing this idea, one that will leave everyone satisfied.

Photo: Barbara Bush in a Columbus Day parade, 1989. (National Archives)

The president’s pretend enemy

There is no crisis of unrest in Portland, Oregon.

One way I know this to be true is that President Trump — who is insistent that Portland faces just such a crisis — doesn’t offer any evidence of it. At some point last month, he may have seen old footage from 2020 on Fox News and decided to declare that the city needed the intervention of federal or federalized troops. (We don’t know that he was watching Fox but he did offer the governor the bemused observation that what she was telling him about Portland didn’t match what he saw on TV.)

On Sept. 27, he declared that the city was “War ravaged,” demanding military presence. A few days later, he claimed that “conditions continue to deteriorate into lawless mayhem,” with “ANTIFA and the Radical Left Anarchists … viciously attacking our Federal Law Enforcement Officers.” He insisted that “[w]e will never allow MOBS to take over our streets, burn our Cities, or destroy America.” That same day, Oct. 1, he insisted that “Portland is a NEVER-ENDING DISASTER. Many people have been badly hurt, and even killed.”

But he hasn’t presented any videos or photos showing this mayhem and murder. No social media clips of rioters running through the streets. No citizens cowering in terror. His social media guru Dan Scavino did post a video showing protesters outside an ICE facility in the city clashing with police and ICE officers. Other than that? You just have to take Trump’s word for it. As when he claimed during a recent White House event that the city “[doesn’t] even have stores anymore. They don’t even put glass up. They put plywood on their windows.”

No wonder a federal judge (appointed by Trump in his first term) described the president’s push to deploy National Guard troops to the city as being “simply untethered to the facts.”

“You look at what’s happened with Portland over the years; it’s a burning hellhole,” he said this week, disparaging that judge (who had “lost her way,” he said). “There’s a huge problem in Portland. I’ll tell you what the problem is: Crime.”

So let’s look at crime data. The Portland Police Bureau reports that reported incidents of vandalism in the city were down in August — the most recent month for which data is available — relative to the recent average for that month. Assaults were up slightly and homicides down, while reported incidents of arson were up. But bear in mind that there aren’t that many incidents of arson in the city; there were 41 in August 2024 and 46 in August 2025.

This approach of claiming that soldiers are needed to quell unrest while not showing any evidence for that need does not seem to be convincing many Americans. Polling conducted by Ipsos for Reuters found that most Americans, including most Republicans, think that Trump should only deploy troops to counter external threats. A plurality thought that Trump should not be allowed to send troops over the objection of state governors.

One group that Trump has convinced, though, is Republican legislators. The president recently signed a memorandum centered on “countering domestic terrorism and organized political violence.” He invoked “riots in … Portland” among evidence of what he described as “sophisticated, organized campaigns of targeted intimidation, radicalization, threats, and violence designed to silence opposing speech, limit political activity, change or direct policy outcomes, and prevent the functioning of a democratic society.”

The memo claimed that “domestic terrorists” were waging an assault on the country “under the umbrella of self-described ‘anti-fascism.’ “

“Common threads animating this violent conduct include anti-Americanism, anti-capitalism, and anti-Christianity; support for the overthrow of the United States Government; extremism on migration, race, and gender; and hostility towards those who hold traditional American views on family, religion, and morality.”

Again, this is predicated, in part, on the fiction about Portland that Donald Trump has created. Leaders in his party have nonetheless embraced it.

On Friday morning, a number of senior elected Republicans claimed that the upcoming “No Kings” protest in D.C. was an arm of this anti-American hostility. It was a “hate-America rally” involving “antifa people,” House Speaker Mike Johnson (R-La.) said on Fox News. House Majority Whip Tom Emmer (R-Minn.) said this “hate-America rally” was being held by the “terrorist wing of their party.” On Newsmax, Sen. Roger Marshall (R-Kan.) described it as a “Soros paid-for protest for his professional protesters,” indicating that the National Guard would be needed.

“Hopefully it’ll be peaceful,” he added. “I doubt it.”

There is a throughline here, and it isn’t that the president is taking necessary steps to keep Americans safe. It is that Trump frames dissent — at Portland’s ICE facility, in the streets of Washington, even simply in the abstract — as a threat that demands a governmental and/or military response. He and his allies have gone from describing Portland’s anti-ICE protests (which now regularly feature people wearing inflatable animal costumes) as a danger demanding armed response to preemptively framing an anti-Trump protest as the work of people the president has defined as domestic terrorists.

For his allies and many of his supporters, it seems, his word on the subject is more than enough.

Photo: Trump at Fort Liberty in June. (White House/Flickr)

A quick reminder that crime is down in U.S. cities

One of the particularly frustrating things about President Trump’s push to send federal officials and red-state National Guard soldiers to cities to “fight crime” is that those cities (and cities generally) are already seeing declines in crime.

It is not the case that there is no crime in those cities, of course, any more than it is the case that national elections see no illegal votes cast. But it is important to recognize that — in the same way Trump’s rhetoric about voter fraud is aimed at changing voting laws — the emphasis on crime here is obviously about rationalizing and justifying the deployment, rather than the other way around. Could military deployments end crime in cities entirely? Probably, but I would imagine you don’t really want to live in a federally mandated police state.

Courtesy of Jeff Asher’s Real-Time Crime Index, which aggregates department data to offer a timely look at crime trends, here is how levels of violent crime in U.S. cities targeted by Trump have changed from July 2019 to July 2025 (the most recent month for which aggregate data are available). These figures are the total number of violent crimes over the preceding 12 months, in order to smooth out seasonal changes.

Notice that in Chicago and D.C., violent crime has been sliding for some time. In Portland, there was a plateau last year but violent crime is again trending down. (This is not how Trump describes the city.)

On a population-adjusted basis, you can generally see the pandemic-era increase in crime and how it has faded. Violent crime in Memphis is much more common than in Chicago, even as it trends down. Crime in D.C. is and has been relatively low.

You probably noticed that each chart shows January 2025, when Trump was re-inaugurated as president. In each city, population-adjusted violent crime numbers are down since that point. In each city, population-adjusted crime is down year-over-year.

There is always more that can be done to combat crime. The question that we should ask is when the government aims to go too far.

Photo: MacGruff the crime dog, seen in 1985. (National Archives)