The (cinematic) future is upon us

Last night, instead of going to bed slightly earlier than usual, I decided that I would instead watch (yet again) the 2006 Alfonso Cuarón film “Children of Men.”

This is a film that evokes strong feelings. It is at best bleak; its ultimate triumph (spoiler alert) sees the protagonist floating through the fog in a small boat. The plot centers on the collapse of humanity and it is resolved with “well, maybe not”? It is not a fun movie, but it does seem fitting for a dark Sunday evening.

So, anyway, that’s what I put on. As it started, I was surprised to realize that it was set in an increasingly approaching future: the once distant year of 2027. Filmmakers are both advantaged and disadvantaged by being unable to completely predict the future. It means that, once that future arrives, we see how far off the mark their predictions might have been. That deviation from reality, though, also means that films set in what was once the future still seem futuristic once that future becomes the past.

When I recently rewatched the original “The Running Man,” a few months ago, I was similarly surprised that the “future” had come and gone. Released in 1987, it was set three decades later — meaning nearly a decade ago. While some aspects of that movie matched the reality of 2017 life (enthusiasm for reality TV foremost among them), it was otherwise … a bit off the mark.

So I assigned myself a project: Find movies set in the future and compare their release dates to the years in which they were set. Which futures are now past? Which are looming? Which aren’t even close to arriving?

The chore of figuring out which movies might qualify and the data on setting and release dates was made infinitely easier by the existence of a Wikipedia page documenting movies set in the future. Some of the included films are dubious (“Home Alone”?) but it was useful for what I had in mind.

So, below: When future-looking movies were released and set, ranked by setting date. I pared the Wikipedia list down significantly, using a few criteria:

  • No superhero movies, because who cares.
  • The plot had to depend to some extent on the film being set in the future.
  • The setting had to be a specific year, not a range or multiple years.
  • It had to be a movie I’ve actually seen.
  • Only one movie per franchise.
  • If I wanted to ignore any of those rules, I could.

Here is the result.

It’s fun to imagine that these movies are all set in the same future. That the train in “Snowpiercer” is also trying to outrun the cyborgs from “The Terminator.” That RoboCop was abandoned so D.C. instead turned to the precogs in “The Minority Report.” That “Avatar” and “Elysium” document different parts of human space exploration in the same year.

There are actually nearly a dozen films on the Wikipedia list that are set in or around 2025. I included only “Her” because of the criteria above — and because it is one of the rare future-set films that actually came close to predicting the actual year in which it was set. (That it was released relatively shortly before that future probably helps.)

“Children of Men” will not prove as prescient, mostly because there have been children born since 2009. The element of the film that centers on the British government rounding up and detaining immigrants, though? Perhaps a bit closer to the mark.

Photo: Promotional still for “Children of Men”. (Universal via IMDB)

A quick and dirty ICE arrest visualization

The always informative Aaron Reichlin-Melnick brought the Deportation Data Project site to my attention. It does what you would think, providing aggregated data on detentions and deportations undertaken by the federal government.

Obtained directly from the government, the information is useful in part because it is broken down into a number of different categories. One can see, for example, the prior criminal histories (if any) of those arrested by ICE. Data are also broken down by state, date and disposition; if there’s information provided by the government, it’s indexed and available for perusal.

Granted, it’s a bit hard to peruse in its raw, tabular form. So I created a quick interactive, displaying monthly totals by state and category. Want to see arrests by criminal history in Delaware? Want to see the percentage of arrests in D.C. that targeted people with criminal histories? Go for it.

Following Reichlin-Melnick’s lead, I also broke out the data so that you can look at all arrests in a month or just those of people who weren’t already in law enforcement custody. (ICE will often arrest and deport people who were already detained by local law enforcement agencies.) You can play with the tool below.

ICE Immigration Arrests by State

Monthly arrest data by criminal status, September 2023 – October 2025

Loading…

Again, this is not entirely polished. For example, there are states with low or no arrests in a given month, meaning that the output of the visualization is volatile or blank.

Even so, I think it provides a useful look at how immigration enforcement has changed in the U.S. since Jan. 20. Play around with it. Let me know what you find.

Photo: An arrest made in Chicago in June. (Paul Goyette/Flickr)

The leftward shifts in special elections are happening in higher turnout races, too

So far this year, there have been five special elections to the House of Representatives. Republicans have won three of those five races — not surprising, since they also won those three seats in last year’s general election.

What is surprising is that, in each of those five races, the Democratic candidate saw double-digit improvement on the final margin over both last year’s Democratic candidate and how Kamala Harris did in the district. On average, the races shifted 16 points to the Democratic House candidate and 17 points relative to Harris.

Those presidential results come from the essential site The Downballot, which has also tracked special election outcomes. Across those contests in 2025 (meaning, including state-level races), the average shift to the left has been about the same: 13 points.

The most recent contest, as you are probably aware, was in Tennessee’s 7th District on Tuesday. Again, the Republican Party held the seat, but much more narrowly than it or Donald Trump won it last year.

Final vote totals aren’t in yet, with the New York Times estimating that about 95 percent of the vote is in (as of the time I compiled this data). But it’s already clear that turnout in the Tennessee special was relatively high for a House special this year — and the Democrat still improved on last year’s margins by 13 percentage points.

It’s important to reinforce that there aren’t a lot of lessons to be drawn from a set of five elections. Everything that’s available reinforces the idea that Democrats will do well in next year’s midterms, certainly, but we should be cautious about using five unusual contests to assume that Democrats will overperform the GOP by 10 points next November.

But this is also why considerations of turnout are useful. One of the reasons that special elections are an imperfect predictor of future outcomes, of course, is that they usually involve fewer voters. If an election instead includes most or all of the vote total for a November contest, we might assume it’s a better indicator of how that district is likely to vote. There are a lot of squishy words there — all or most, better, etc. — but the idea holds.

In each of the five special House elections this year, the Democratic candidate received fewer votes than the candidate in last year’s general, just as the Republican candidate received fewer votes than last year’s Republican. But in each case, the 2025 Democratic candidates captured a larger share of their party’s 2024 House vote totals than Republican candidates did of theirs. On average, Democratic special election candidates got 52 percent of the 2024 Democratic candidate; the Republican special election candidates got 37 percent of the 2024 Republican.

In Tennessee, Democrat Aftyn Behn got 7 votes for every 10 the 2024 candidate for that seat got. Her opponent, Matt Van Epps, got about 5 votes for every 10 the Republican got last year.

There are a lot of reasons such a discrepancy might exist. Perhaps a lot of people who voted for the Republican last year backed the Democrat this year. Perhaps Democratic voters were more energized to turn out to vote. Perhaps it’s a function of the difference between last year’s specific candidates and this year’s.

Whatever the reason, the dual pattern — less drop-off for the Democrat and a shift to the left in the overall margin — are working against Trump’s party. Even in a race where Republicans managed to turn out some 100,000 voters for a special House election (as will likely be the case in Tennessee), those patterns hold true.

Comparing House races to House races seems like a better point of comparison than contrasting the House special elections with the 2024 presidential contest. But, if you’re curious, here’s that comparison.

In this case, the shift to the left in Tennessee was more modest than in the other four special elections. Republicans investing heavily in the idea that this means that higher relative turnout in 2026 will further erode the leftward shift in House races might scroll up a bit and notice that in Arizona’s 7th, where turnout was relatively modest compared to last year’s House race, the shift to the Democrats was about the same as in the relatively higher turnout in Tennessee.

We risk overreading all of this, of course. This is what happens, though: in the absence of concrete information about next year’s midterms, an election of enormous significance, we dig through whatever tea leaves litter the bottoms of our cups.

Above, you can see five leaves in two different cups. Have fun with your forecasting.

Photo: Tracking the results of the 1954 election. (National Archives)

How severe is the political pessimism of young Americans?

Somewhat buried in the pre-Thanksgiving conversation, Dartmouth College’s Brendan Nyhan offered an interesting observation in an essay for the New York Times.

“[T]he scale of the protests” targeting Donald Trump this year, he wrote, “is still not as large as one might expect, given the severity of the threat. During President Trump’s first term, millions of people protested when the situation was far less dire.” He offered one reason for that decline: “the lack of young people.”

Nyhan pointed to YouGov polling that showed less interest in October’s “No Kings” protests among younger Americans than older ones. He contrasted that with the protests that followed the killing of George Floyd in May 2020; then, younger Americans were more likely to tell YouGov that they’d participated in a protest.

I’ll note that this specific comparison is partly a function of interest. In 2020, YouGov polling shows that far more young people expressed agreement with the Black Lives Matter movement than did older people. This time around, older people — who are more likely to have lived through the Cold War struggle between democracy and autocracy — say they are more dissatisfied with the state of American democracy, the issue at the heart of the “No Kings” movement.

In his essay, though, Nyhan also points to another factor: a sense of hopelessness.

“The more persuasive explanation for the relative lack of young people in the anti-Trump, pro-democracy movement is that they are demobilized and demoralized. But it would be a mistake to blame them for this attitude. Older generations should instead recognize that the world we have created does not seem to offer a viable path to making change.”

This is almost certainly true. When Gallup reported that record numbers of young women expressed an interest in leaving the U.S., I noted that this was likely in part a function of feeling as though there was no means by which their frustrations could be addressed. Democracy depends on the idea that power jostles back and forth between interests. If you feel as though the system has excluded or marginalized you indefinitely, what’s the point of sticking with it?

Such a sentiment isn’t only detectable in protest apathy or an expressed (though generally not manifested) interest in emigrating. It’s visible in the prevalence of independent voter registrations among young people, in skepticism about the media as an institution and in the quick collapse of both Trump’s and Joe Biden’s approval numbers among the youngest Americans.

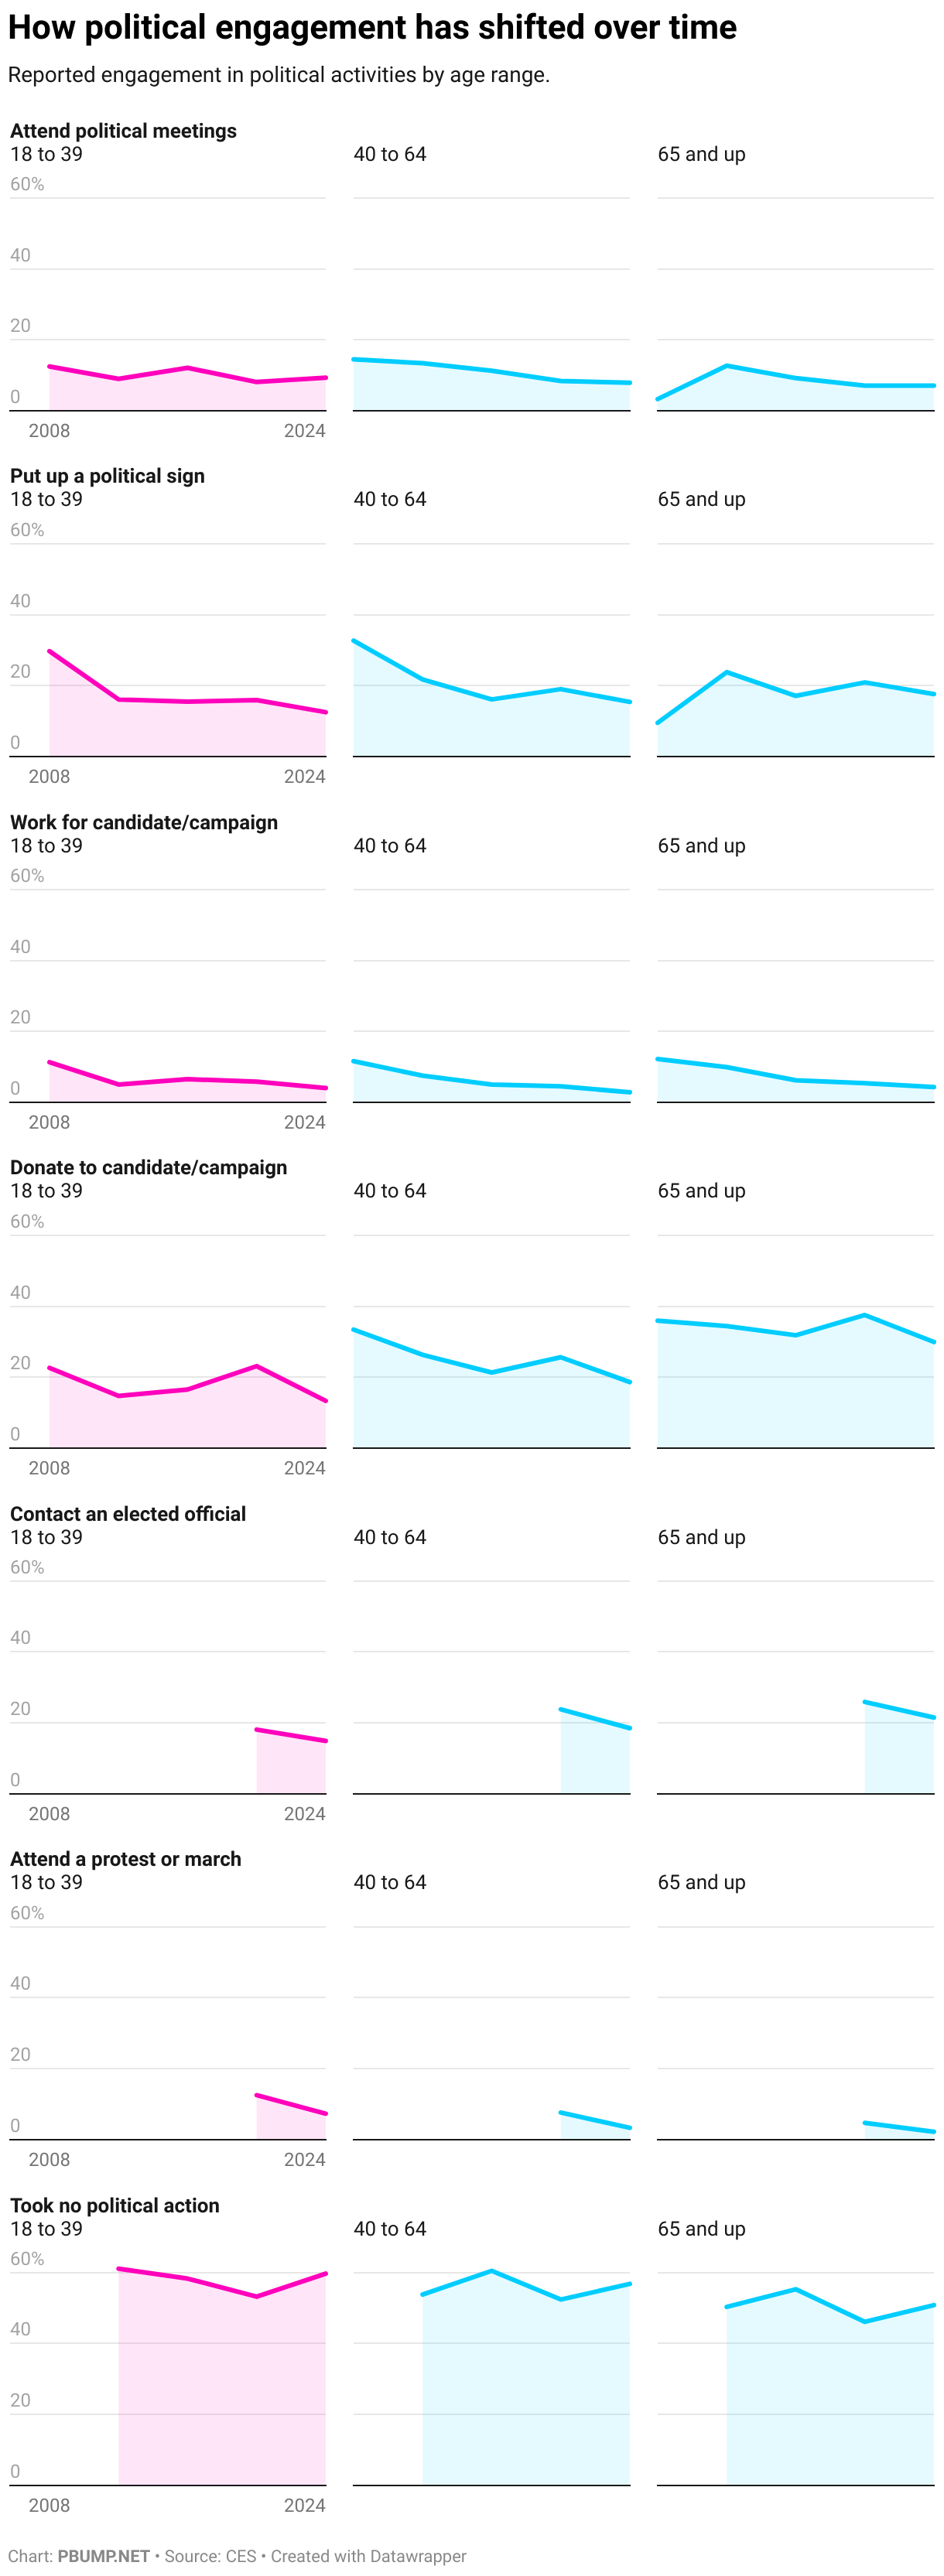
It’s also suggested by the broader contraction of young people’s engagement in politics.

I’m not referring to voting. Young people consistently vote less heavily than older Americans, for a number of largely structural reasons. (For example, young people often hold jobs that afford them less flexibility to cast a ballot and move more often, meaning that they need to re-register to vote and perhaps figure out where to do so.) But young voters were more likely to vote in 2024 than they were in 2008, once considered a high-water mark for young-voter participation.

But they voted more heavily still in 2020. And even with relatively higher voting rates in 2024, young people made up much less of the electorate than they do the adult population.

Again, though, that’s not what I’m talking about. Instead, I’m talking about other engagement with the political system.

The Cooperative Election Study is a national poll conducted around each federal election. It includes an evolving set of questions measuring how often respondents engaged in non-voting political activity: going to meetings, putting up a sign, participating in a protest, donating to a candidate.

On many of those metrics, young people — and older people! — indicated less participation in 2024 than they had in 2020 or prior years.

There were only two activities in which young people were more likely to report participating than older people in the 2024 survey: attending political meetings and attending protests. The percentage reporting participation in protests was down nearly 7 percentage points from 2020, the biggest drop among any of the three age groups. Meanwhile, the percentage of younger people who reported having engaged in none of the identified actions was up more between 2020 and 2024 than was the case among older respondents.

It’s worth noting that this was also true just among young people who identify as Democrats or Democrat-leaning independents. In 2020, only 44 percent of them indicated they’d engaged in none of the identified political actions (compared to 60 percent of young Republicans and Republican leaners). In 2024, more than half of young Democrats indicated that they hadn’t engaged in any of the activities (while young Republicans held steady at 60 percent).

It has been a disheartening political moment for young Americans (who are more likely, for example, to oppose the government’s approach to the war in Gaza), for young Democrats (who watched a Democratic president about whom they were often apathetic be replaced by Trump) and for young women in particular (given the revocation of Roe v. Wade, among other things). The response from older Democrats has often been something like “well, you should vote!” which isn’t wrong, as such, but is still clearly not going to be seen as sufficient.

There’s another interesting aspect to the numbers here that is worth pointing out. Remember: young Americans were least likely to express dissatisfaction with democracy in the U.S. in YouGov’s recent polling … perhaps in part because they don’t expect any better. Maybe that will change after the 2026 election, a point at which — should democracy actually be functioning normally — power is likely to jostle back toward the left.

Photo: A “No Kings” protester in October. (~jar{} on Flickr under Creative Commons license)

Republicans support going to war in Venezuela (but wouldn’t mind knowing why)

It is a truism by now well-established that many or most Republicans will agree with President Trump, no matter what. There are issues on which parts of his base will go sideways (like on immigrant visas) but they (and the legislators they’ve elected to Congress) are generally content to clap along with whatever Trump is doing.

You might therefore find it mildly surprising that, in a poll conducted by YouGov in September, a plurality of Republicans expressed opposition to invading Venezuela — a possible action suggested by a build-up of American military forces in the area. More nuanced questions about U.S. involvement evoked more support (both from Republicans and overall), but in no case did at least half of Trump’s party say they supported deployments.

That was then.

Over the weekend, CBS News published new YouGov polling, showing that most Republicans now support military action against Venezuela. A large majority of everyone else opposes it.

What changed? Two things. First, the more recent poll eliminated the “not sure” option, forcing people to choose between support and opposition. Probably the most significant shift, though, was that Trump and his administration have more openly embraced the idea of launching military strikes, moving the idea from something abstract to something that has the president’s potential blessing. With that comes Republicans approval.

Before you accuse me of being cynical, allow me to point out that most Republicans also say they know little to nothing about Venezuela. So a chunk of Trump’s party that admits to not knowing much about the country is also supportive of going to war with it.

That said, Republicans still align with the public overall in thinking that Trump should get Congress’s approval for any action and make a stronger case for the need for action, something he hasn’t yet done. They are less likely to think those things are necessary than are Democrats or independents, but a majority still holds those views.

But it probably doesn’t actually matter. If, as has been hinted, military strikes are imminent, Trump’s supporters would be forced to choose between their interest in Trump’s building consensus and his having already taken action. As noted at the outset, history suggests that this wouldn’t be a particularly difficult choice after all.

However much the rationale echoes one the party has spent more than a decade rejecting.

Photo: Jets fly over the White House. (White House/Flickr)